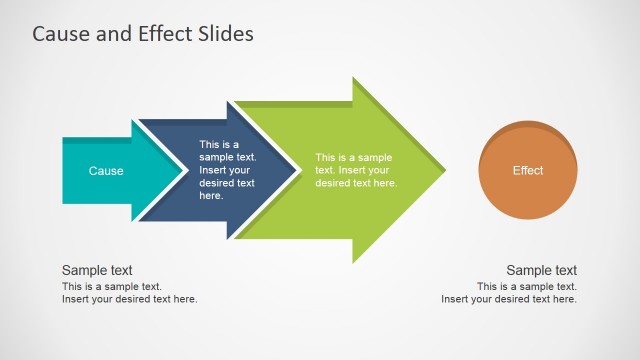
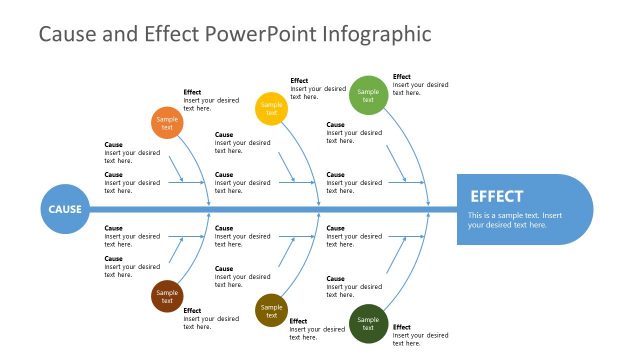
Ishikawa Diagram for Cause & Effect Analysis Slide
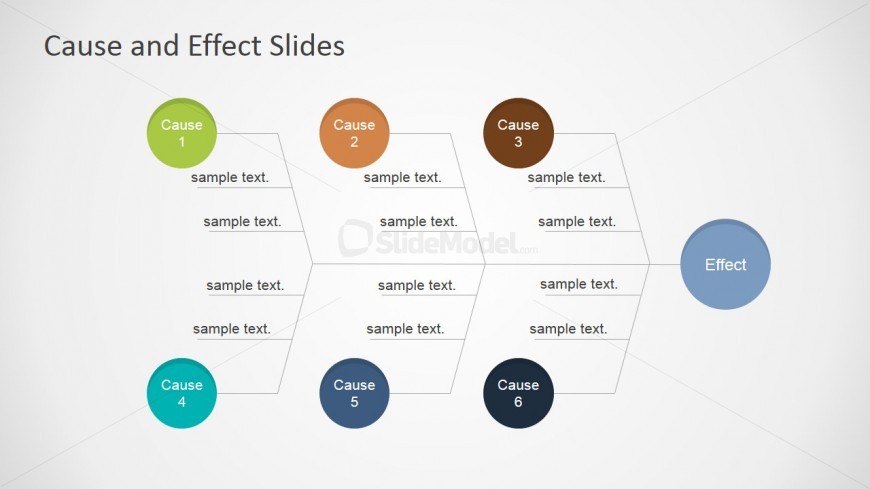
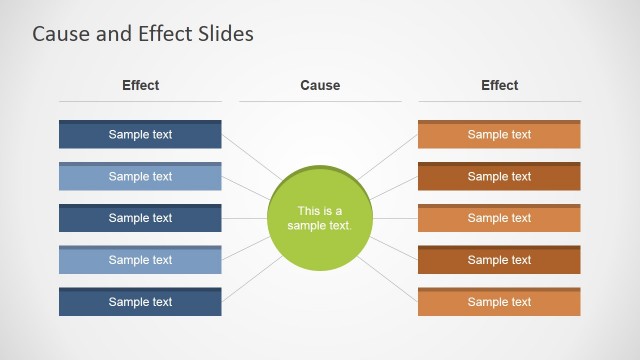
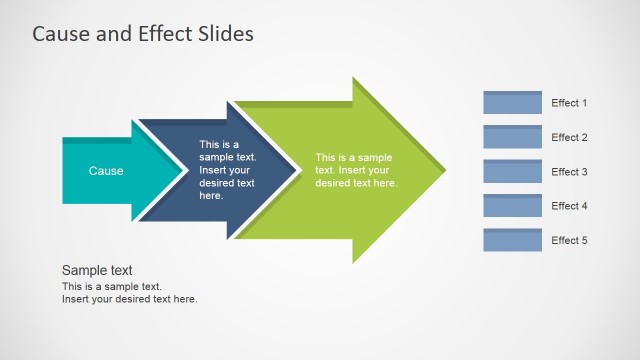
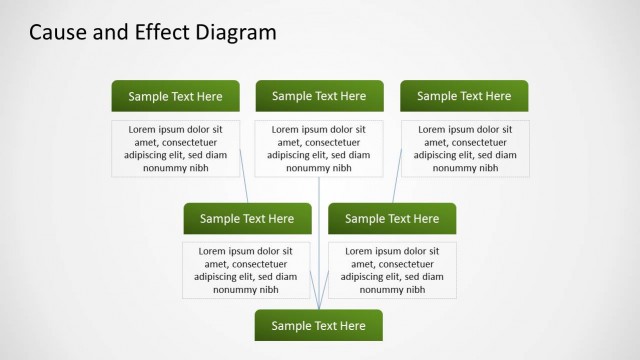
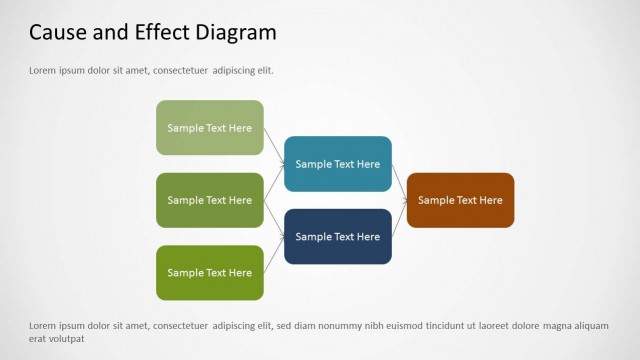
Fishbone diagram (aka Ishikawa Diagram) useful for Cause & Effect Analysis presentations in Microsoft PowerPoint. This slide contains a simple fishbone diagram created with PowerPoint shapes where you can present a cause & effect analysis in PowerPoint. This graphic can help to support the presentations on cause & effect and help to identify the possible causes of a problem in an organization or process, then analyze what is causing the problems and help finding solutions.
Return to Cause & Effect PowerPoint Template.