CAGE Analysis PowerPoint Template
Download our 100% editable CAGE Analysis PowerPoint Template to create a comprehensive chart representing the international differences among the countries. For the international expansion of the business, corporations always look for multiple factors that can affect their expansion. CAGE is an acronym for the four factors that primarily affect this expansion, i.e.,
- Cultural distance: This perspective considers differences in language, cultural values, traditions, and beliefs.
- Administrative distance: It involves knowing how the governance laws, policies, and rules vary compared to the country of origin.
- Geographic distance: Geographical distance greatly impacts business activities; thus, this difference is important for planning the future of business in a new country.
- Economic distance: Like other primary factors, studying economic conditions is crucial for managing finances and knowing how the expansion will impact the growth in the secondary state.
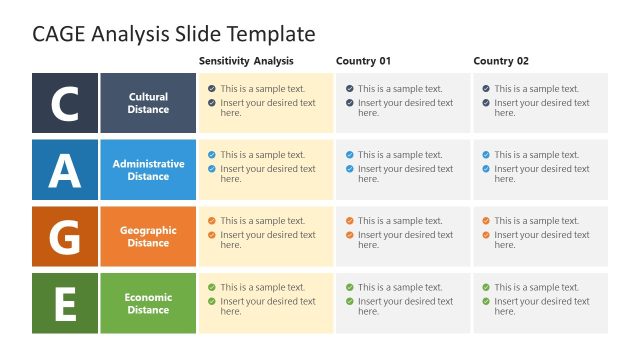
To study the impact of these factors, professionals perform sensitivity analysis and note their data points using a chart. We have created this CAGE analysis template to prepare a thorough analysis chart.
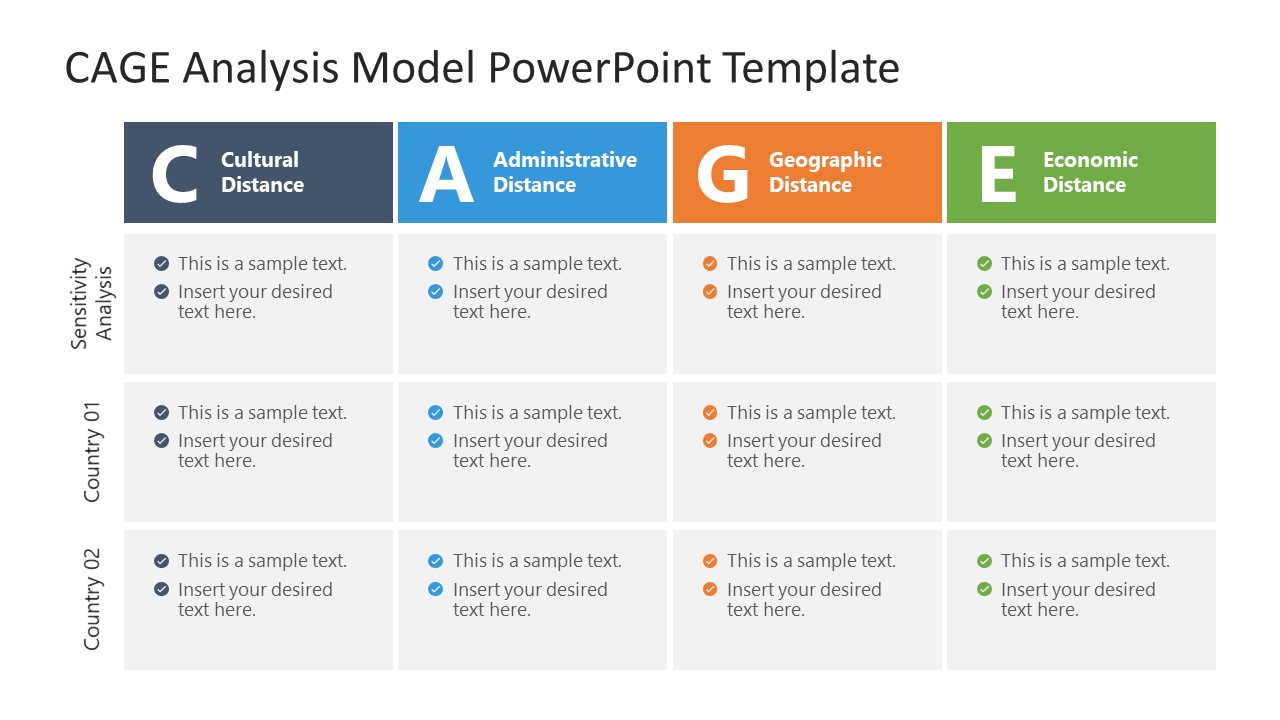
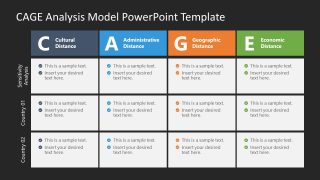
This CAGE Analysis PowerPoint Template slide has a 4×3 table diagram with editable segments. The columns of this chart indicate the four factors and the rows mention the sensitivity analysis results and comparison points of two destination countries. The columns have colored title sections with bold letters. The table’s cells have bullet points with placeholder text to mention the key points. Users can edit these text boxes to add their presentation points. The fonts, colors, and other design features can be adjusted accordingly.
The slide template includes the concept of CAGE Distance Framework, which identifies four different dimensions (Cultural, Administrative, Geographic and Economic) and its differences or distances between countries that companies should address when crafting international strategies.
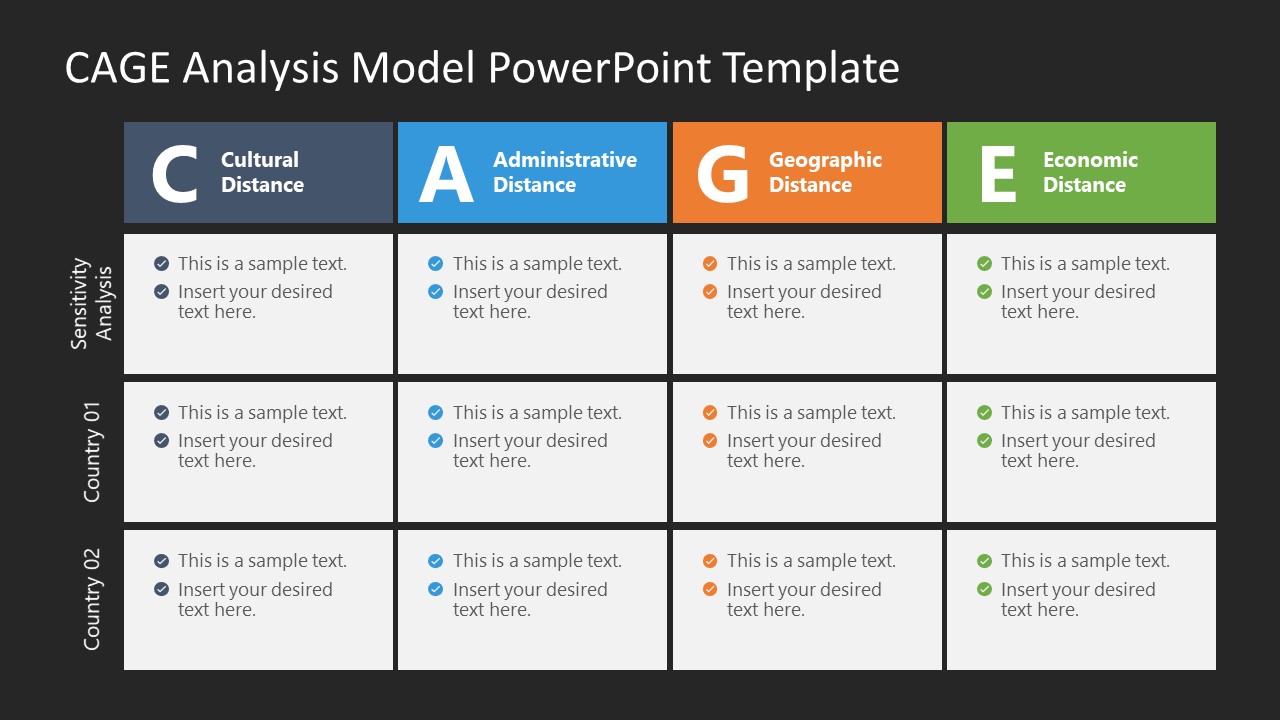
This CAGE PPT slide is also provided with a dark background variation. So, download and conveniently prepare your CAGE analysis chart in a few steps. Alternatively, you can download other PPT slides for PowerPoint or templates from a collection of 100% editable PowerPoint presentation templateswhich can help business planning teams and entrepreneurs simplify creating their planner charts.

You must be logged in to download this file.
DOWNLOAD- Category
- Models
- Rating

 Loading...
- Item ID
- 22028-01
- Colors
Subscribe today and get immediate
access to download our PowerPoint templates.