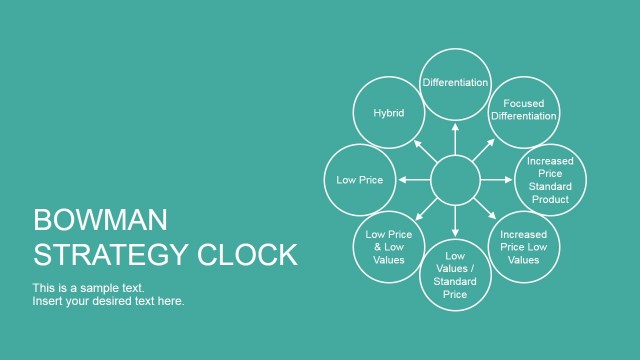
Bowman’s Strategy Clock Diagram for PowerPoint is a presentation template with the popular business model to analyze the competitive position of a company in comparison to the offerings of it competitors.
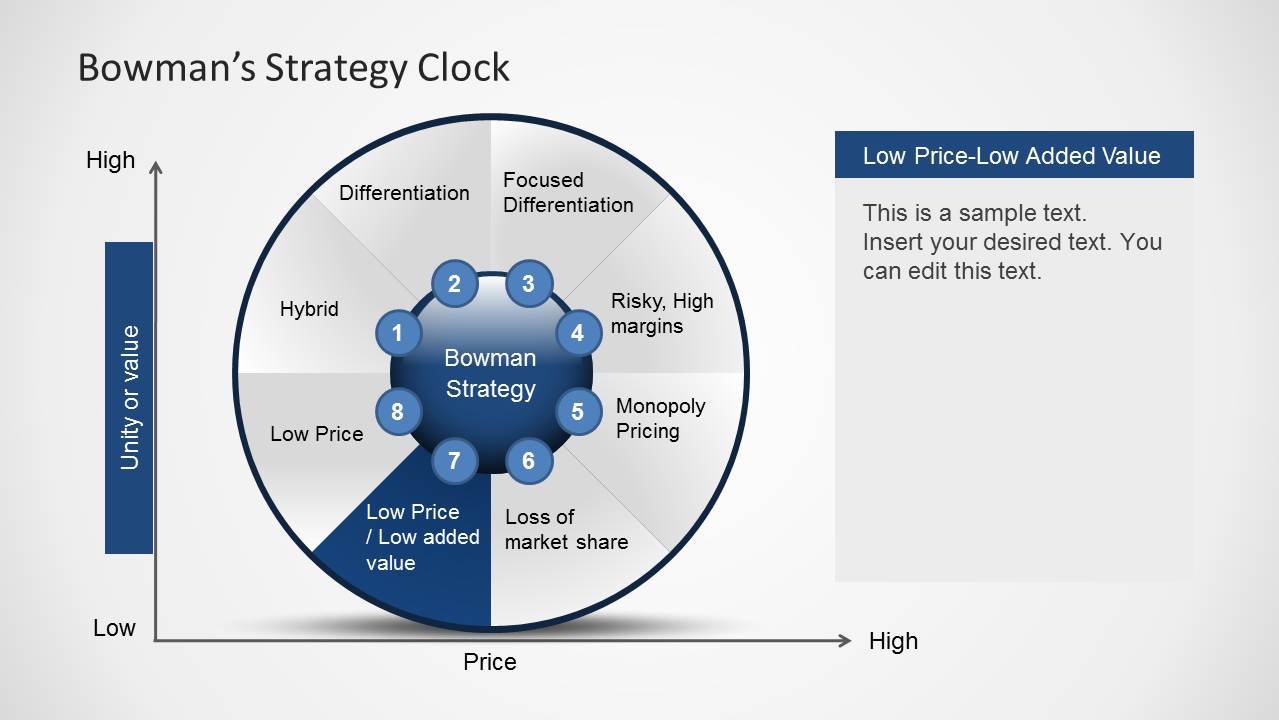
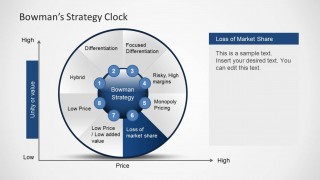
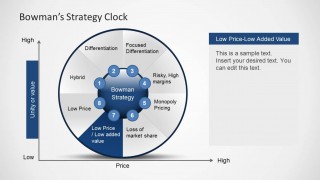
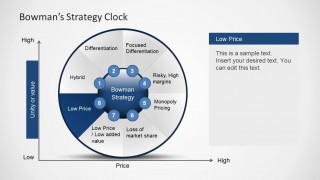
The Bowman’s Strategy Model was developed by Cliff Bowman and David Faulkner as an elaboration of the three Michael Porter Generic Strategies. Bowman’s Strategy Clock diagram for PowerPoint represents 8 possible strategies.
What’s inside this template
Example presentation scenarios
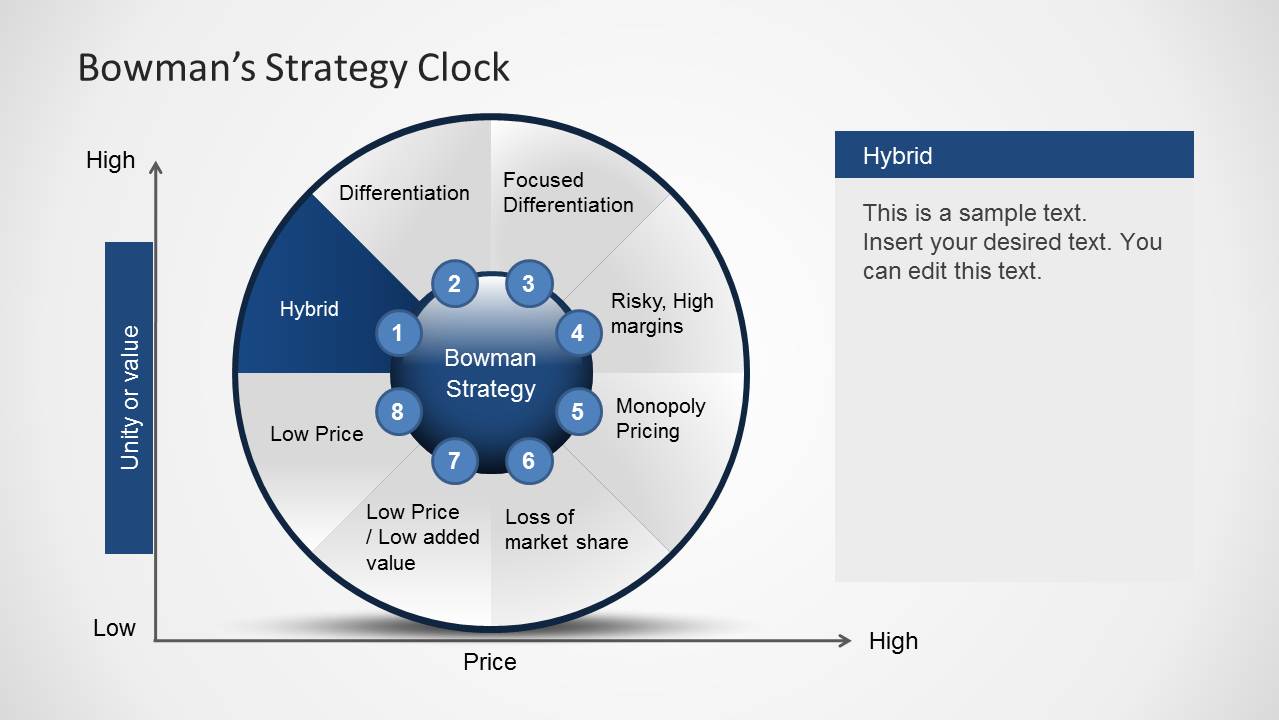
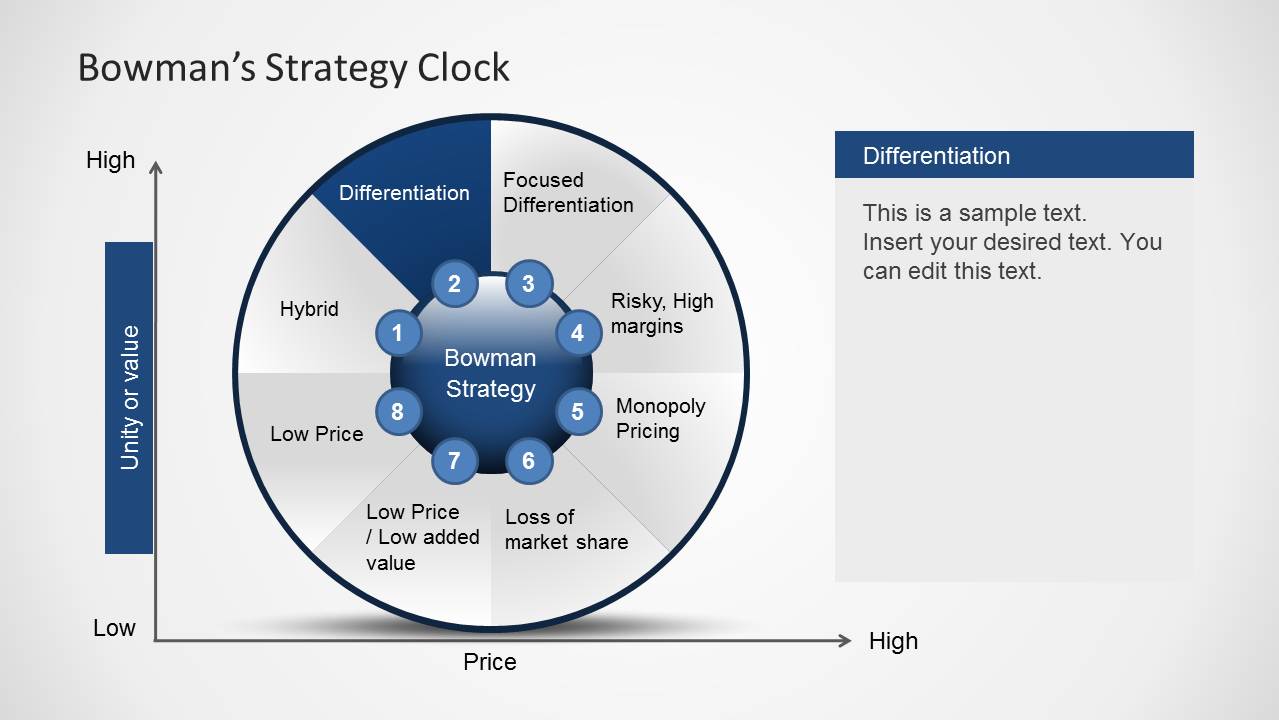
- A strategy consultant can use the highlighted Hybrid, Differentiation, and Low Price sectors to compare a client's current position against competitor offers during a planning meeting.
- A marketing leader can use the price-value axes and right-side callout panels to explain why a brand should pursue focused differentiation instead of competing only on price.
- A product manager can use the Monopoly Pricing and Risky, High Margins slides to discuss premium pricing risks with executives before a launch decision.
- An instructor can use the eight-position circular matrix to teach Bowman's Strategy Clock in a business strategy class and assign each sector to a case example.
Features
- 100% editable presentation template
- Compatible with Microsoft PowerPoint and Google Slides
- Scalable vector shapes, icons and illustrations
- AI-Ready for Microsoft Copilot and Claude
- Instant access and download
Frequently asked questions
Q: How should a presenter explain the clock without overwhelming the audience?
A: Start with Slide 1 to define the two axes: price and utility or value. Then move through only the sectors that matter to the decision, using the highlighted slides as discussion stops. The right-side callout should state the implication for the business, not repeat the label already shown in the circular diagram.
Q: Who is this template best suited for in a strategy discussion?
A: This template fits consultants, product leaders, marketing managers, and business instructors who need a shared language for competitive position. It works best when the group is deciding between pricing and differentiation paths, such as Hybrid, Low Price, Focused Differentiation, or Monopoly Pricing, rather than presenting a detailed operating plan.
Q: Why does the clock metaphor help communicate competitive strategy?
A: The clock metaphor places strategy options around a single circular field, so the audience can see pricing and value choices as related positions rather than isolated bullets. Highlighting one sector per slide creates a guided comparison and reduces confusion when discussing adjacent options such as Differentiation, Focused Differentiation, and Risky, High Margins.
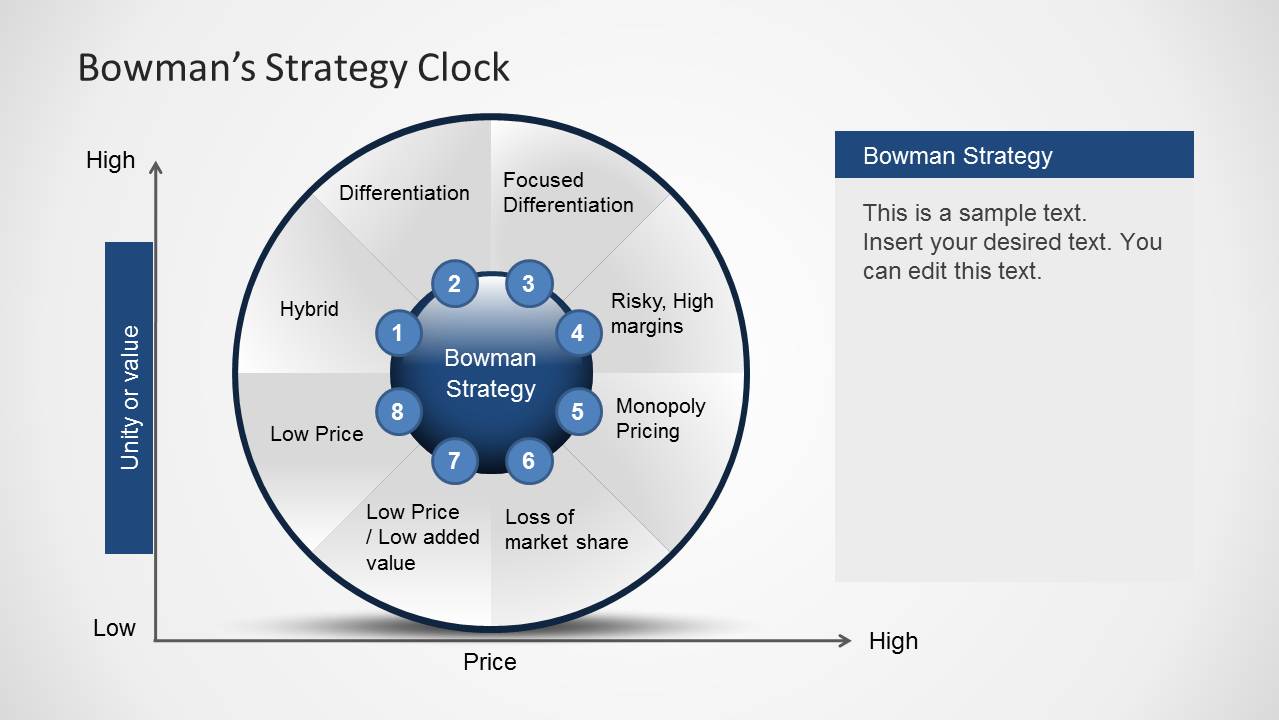
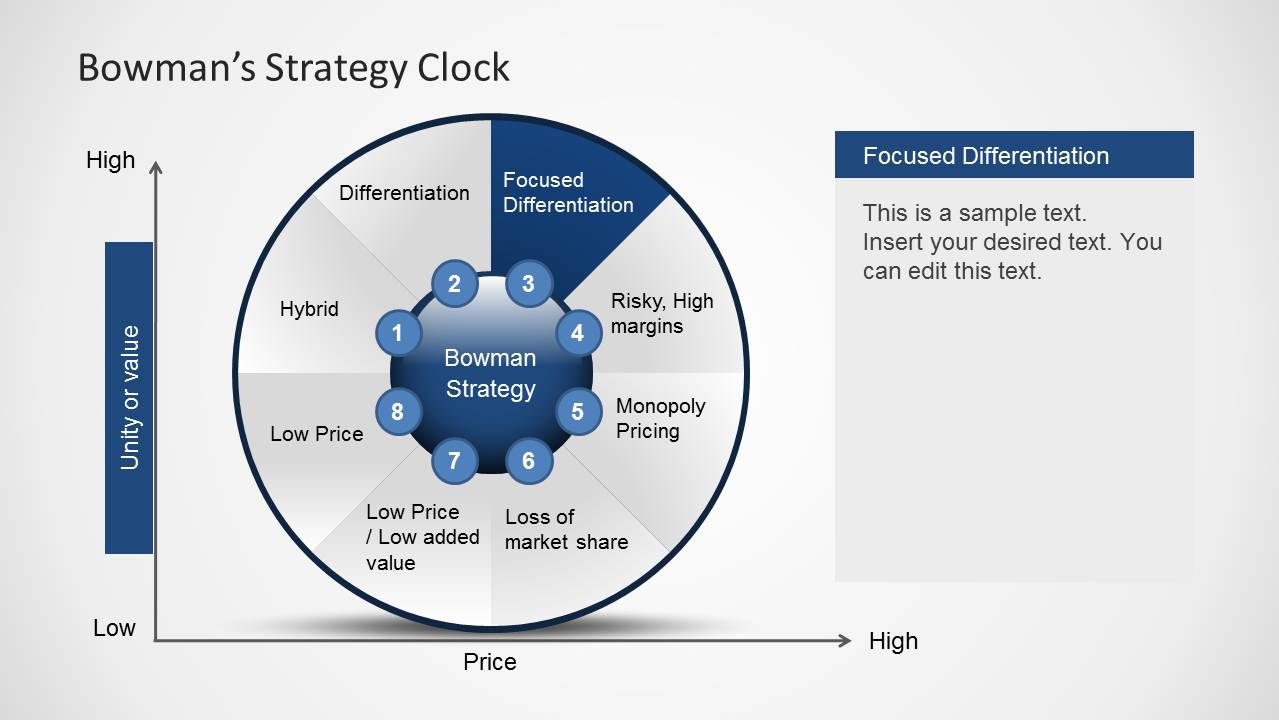
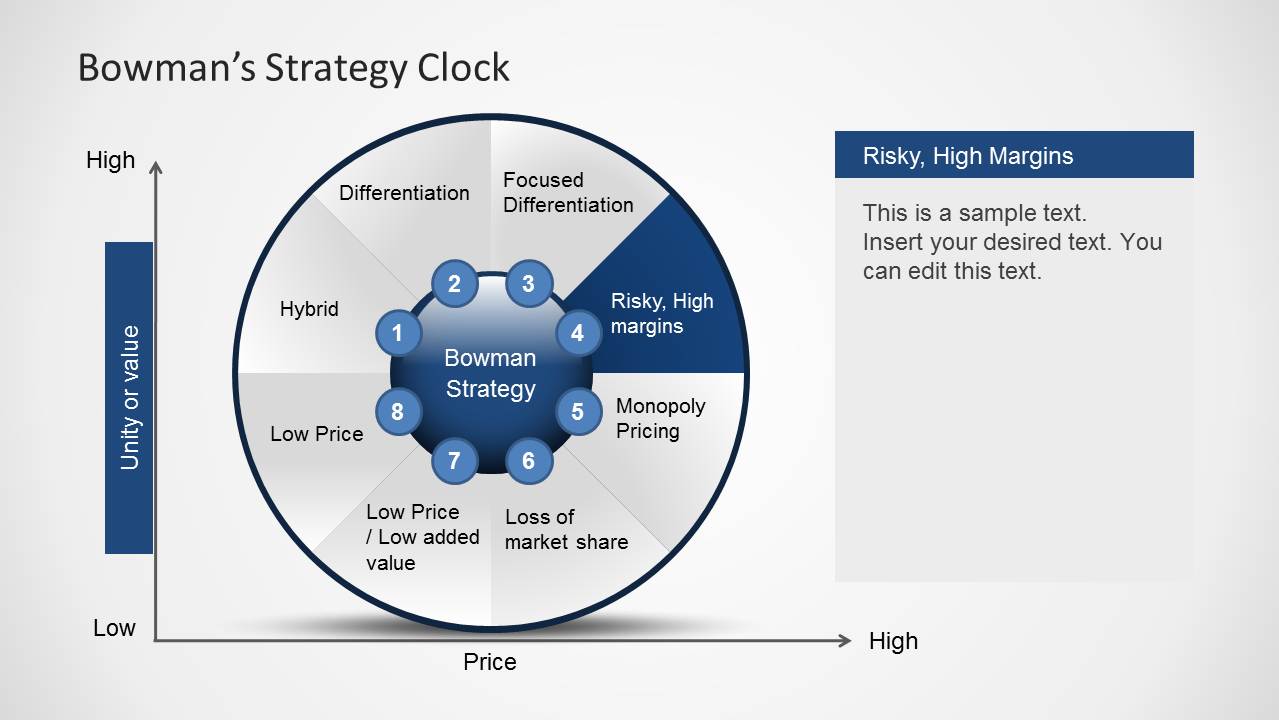
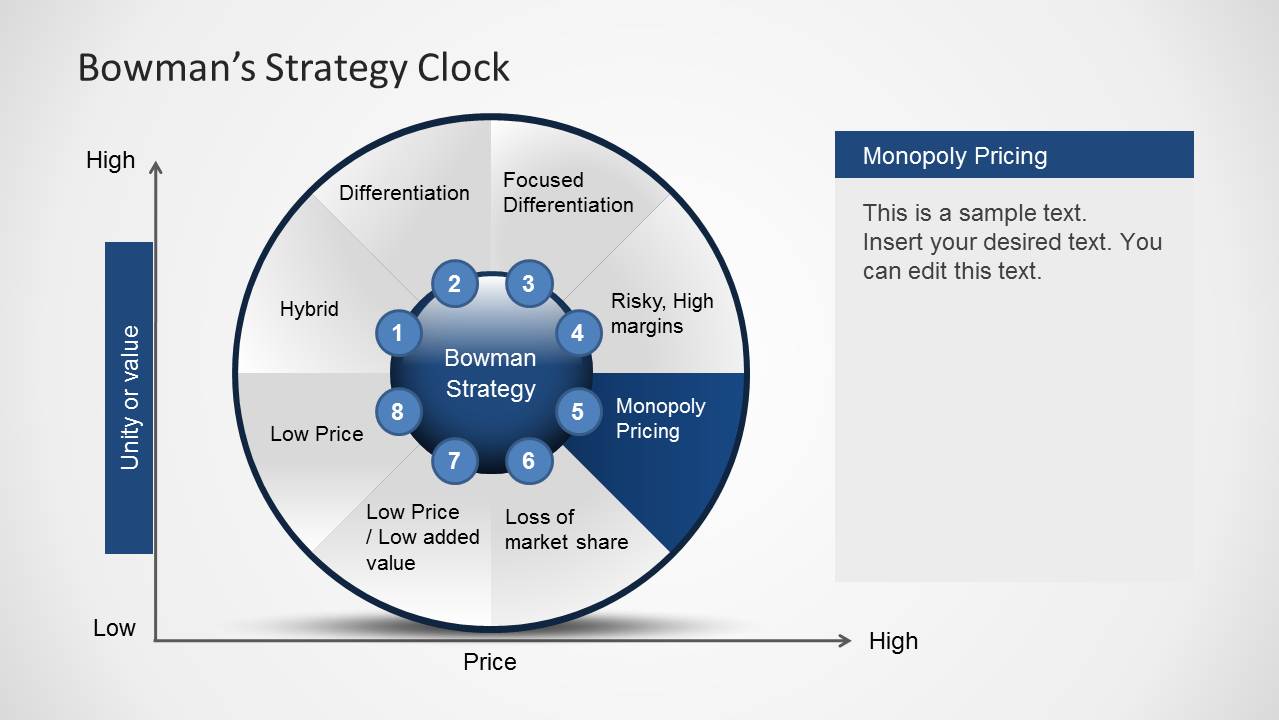
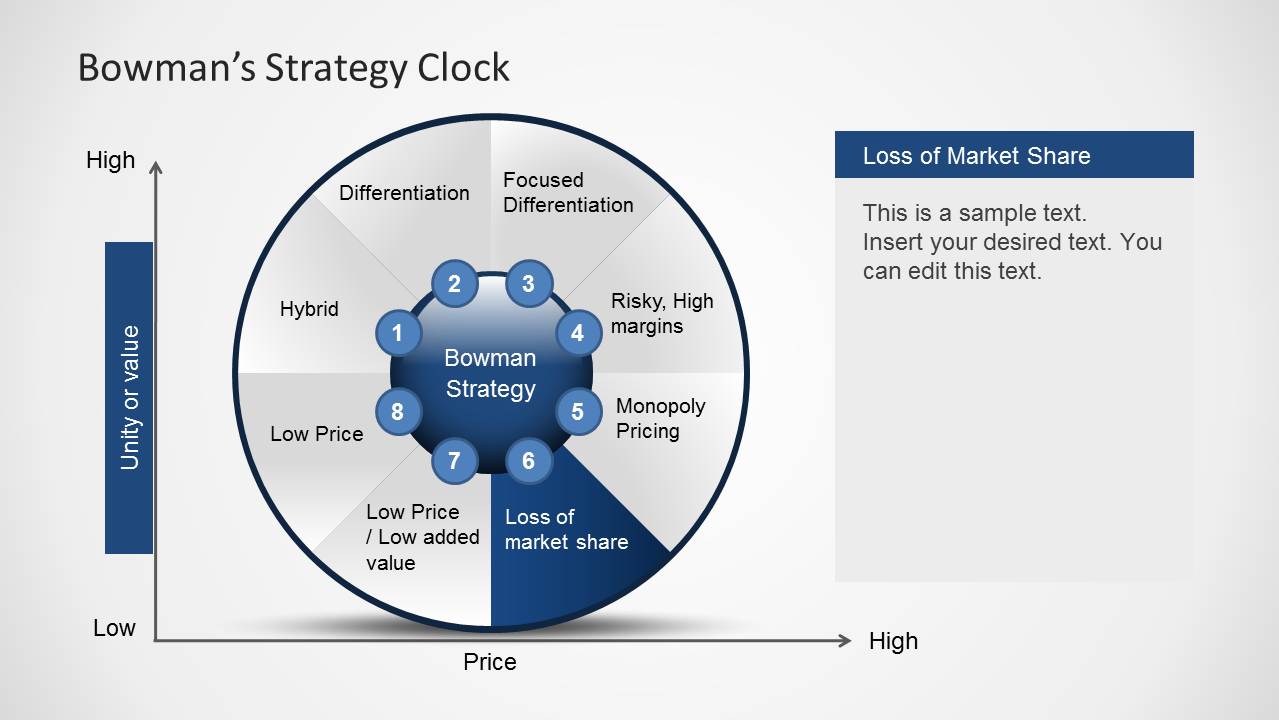
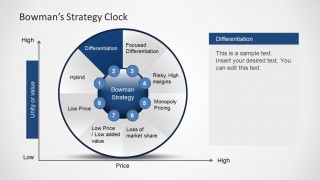
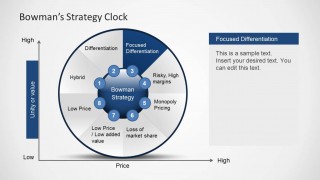
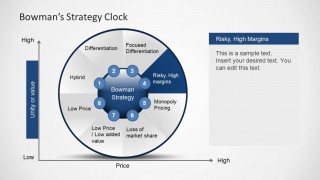
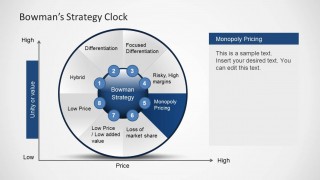
Bowman’s Strategy Clock Diagram for PowerPoint
9-slide PowerPoint strategy diagram template for Bowman's clock, price positioning, differentiation strategy, and competitor analysis
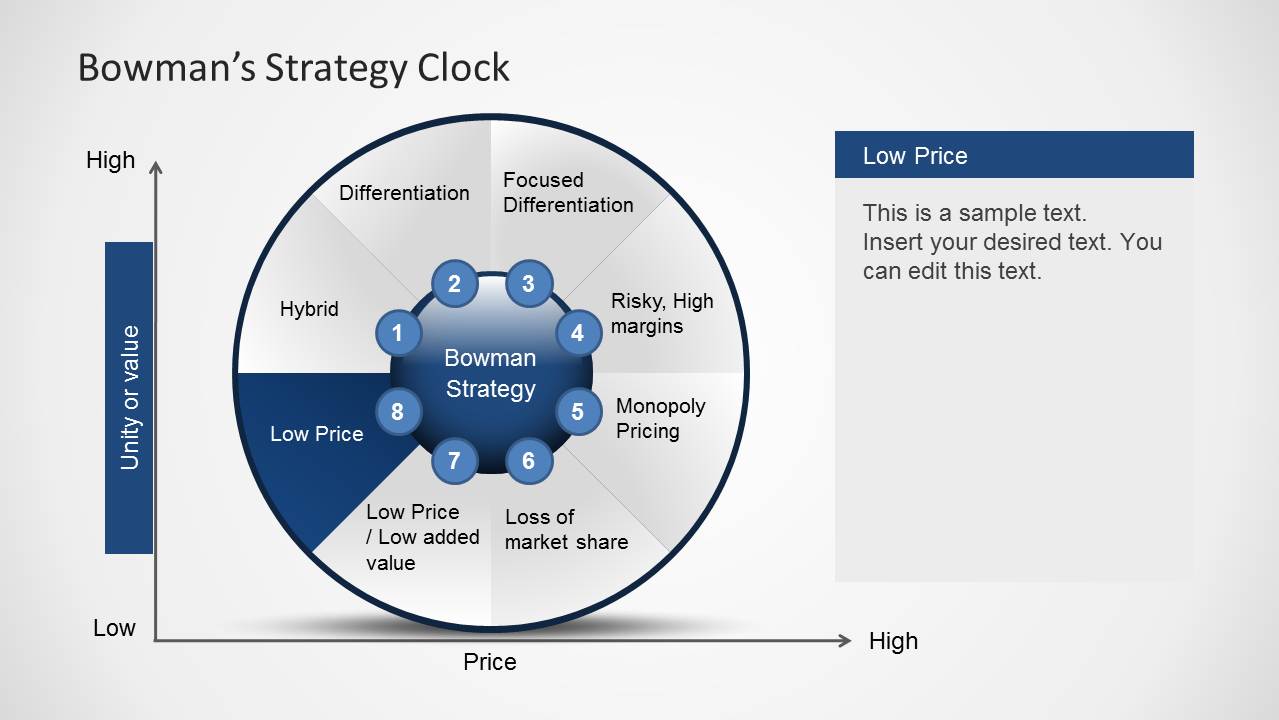
Bowman's Strategy Clock Diagram for PowerPoint is a 9-slide strategy template for explaining competitive positioning by price and perceived value. It includes a circular Bowman's clock matrix, price-value axes, highlighted strategy sectors, and right-side text callouts for Hybrid, Differentiation, Focused Differentiation, Monopoly Pricing, Low Price, and related positions.


 Loading...
 Microsoft PowerPoint
  Microsoft Copilot
  Claude for PowerPoint
 Other formats supported
Subscribe today and get immediate
access to download our PowerPoint templates.