Slide 2 of 9 from Bowman's Strategy Clock Diagram for PowerPoint
Bowman Strategy Clock Diagram for PowerPoint
Bowman's Strategy Clock for Competitive Positioning
- Diagram
- Circular Cycle
- Strategic Analysis Slide
- 16:9
- 100% Editable
The Bowman's Strategy Clock Diagram slide from the Bowman's Strategy Clock Diagram for PowerPoint template offers a clear circular cycle layout ideal for competitive analysis and pricing strategy presentations. This slide integrates editable shapes and vector icons to visually represent eight distinct market positioning strategies, facilitating detailed discussions in business presentations and pitch deck templates focused on strategic analysis.
About This Slide
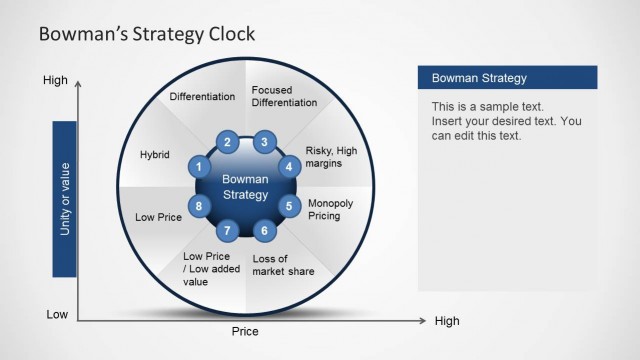
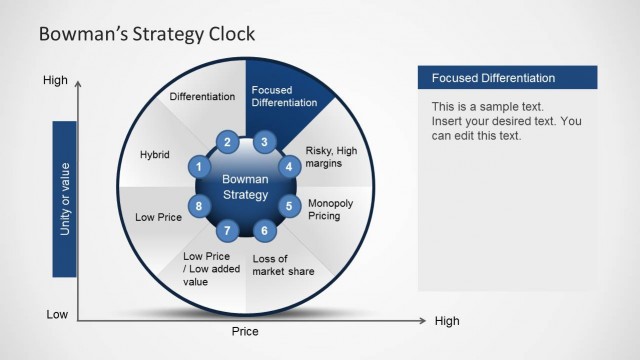
On the slide design is a Bowman Strategy Clock Diagram for PowerPoint. It is specifically designed to show the company’s relative position amongst its competitors. The Bowman’s Strategy Clock shows eight different strategies to become competitive. This PowerPoint slide highlights the Hybrid Strategy.
On the right side of the slide is a text box with a dark blue header. Labeled “hybrid”, this may be used to show descriptions and labels. The Bowman’s Strategy Clock is made with PowerPoint shapes. It is shown with blue outlines. At the center of the clock are eight small circles. These contain numbered labels from one to eight. The PowerPoint objects are 100% editable. They may be customized to suit the presenter’s needs and preferences.
What’s on This Slide
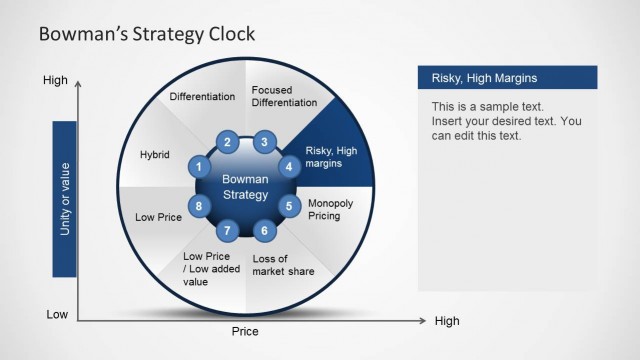
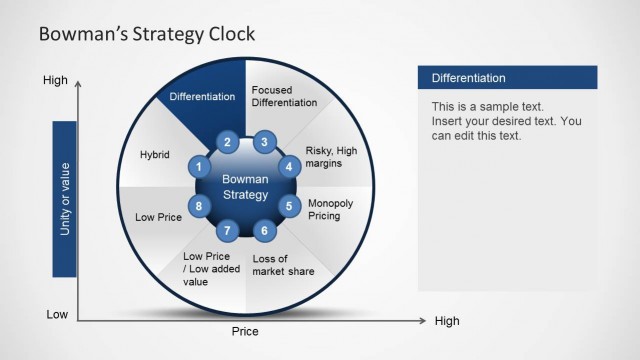
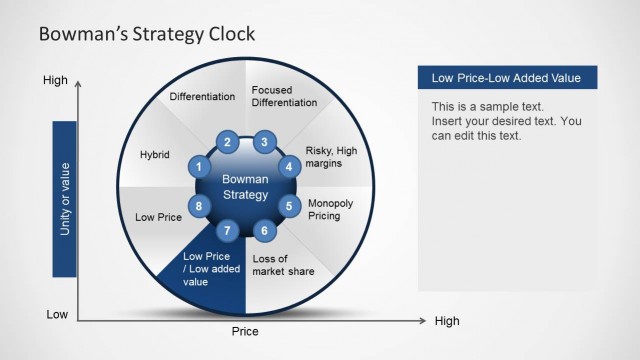
The slide features a circular diagram divided into eight segments, representing different competitive strategies. Each segment is labeled with terms such as 'Hybrid,' 'Low Price,' and 'Monopoly Pricing.' The central area contains 'Bowman Strategy' in a bold font. A vertical axis on the left indicates 'Unity or value,' while a horizontal axis at the bottom shows 'Price.' A text placeholder is positioned on the right side, aligned vertically, allowing for additional descriptive content. The color scheme includes blue and white, enhancing visual clarity.
How to Use It
This layout serves as a strategic framework for discussing competitive positioning based on price and perceived value. It fits well after an introductory problem slide, leading into detailed discussions of market strategies. This slide is useful for business presentations focused on competitive analysis, pricing strategies, and market segmentation. It can effectively illustrate how different strategies relate to price and value, guiding decision-making in strategic planning sessions.
Text Placeholders & Capacity
Keep your copy within these limits so it fits without resizing. Node labels can accommodate roughly 2-3 words each.
| Placeholder | Count | Max characters (approx.) |
|---|---|---|
| Slide title | 1 | 30 |
| Item heading | 8 | 20 |
| Body paragraph | 1 | 100 |
Slide Keywords
Download unlimited PowerPoint templates, charts and graphics for your presentations with our annual plan.
DOWNLOAD