Slide 6 of 9 from Bowman's Strategy Clock Diagram for PowerPoint
6236-01-bowman-strategy-clock-diagram-chart-6
Bowman's Strategy Clock Diagram for PowerPoint
- Diagram
- Matrix Quadrant
- Strategic Analysis Slide
- 16:9
- 100% Editable
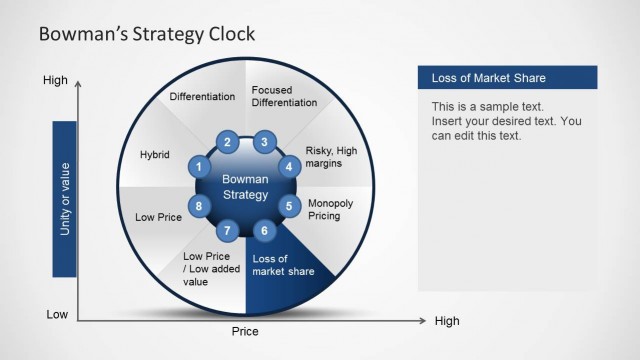
The Bowman's Strategy Clock Diagram slide from the Bowman's Strategy Clock Diagram for PowerPoint template offers a clear visual tool for strategic analysis. This slide layout uses editable shapes and vector icons to illustrate eight competitive strategies, supporting detailed market strategy discussions and business presentation needs. It integrates seamlessly into corporate presentations and pitch deck templates focused on competitive positioning and pricing strategies.
What’s on This Slide
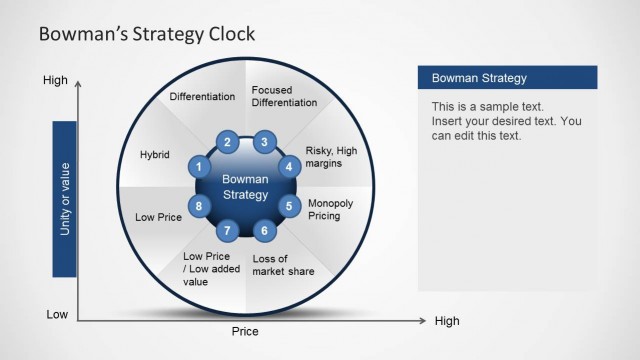
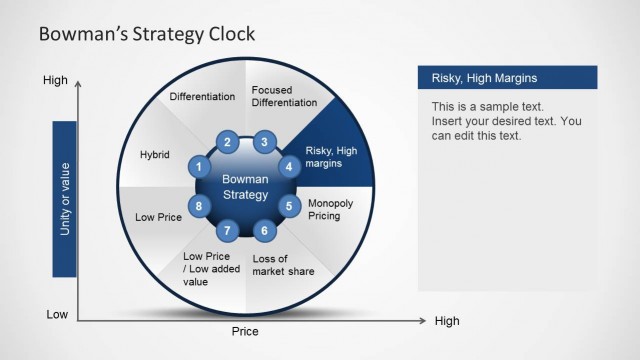
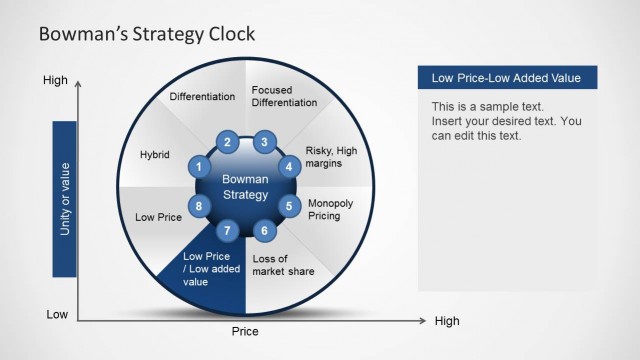
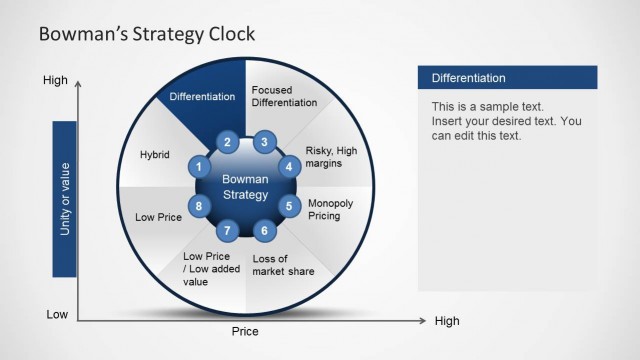
The slide features a circular diagram divided into eight segments, each representing a different strategy in Bowman's Strategy Clock. The center contains a labeled node for 'Bowman Strategy.' The segments are arranged clockwise, with labels such as 'Differentiation,' 'Focused Differentiation,' and 'Monopoly Pricing.' A text placeholder is positioned on the right side, aligned vertically, labeled 'Monopoly Pricing,' with additional sample text below it. The diagram is set against a light background, enhancing the visibility of the blue and gray elements, which create a clear visual hierarchy.
How to Use It
This layout serves as a strategic analysis tool, illustrating competitive positioning based on price and perceived value. It fits well in a presentation discussing market strategies, competitive analysis, or business models. This structure can be used to compare different pricing strategies or to highlight the implications of each strategy on market positioning. It is suitable for business meetings, strategy sessions, or educational contexts where competitive frameworks are discussed.
Text Placeholders & Capacity
Keep your copy within these limits so it fits without resizing. Node labels can hold about 20 characters each, while callout text can accommodate roughly 100 characters.
| Placeholder | Count | Max characters (approx.) |
|---|---|---|
| Slide title | 1 | 30 |
| Item heading | 8 | 20 |
| Item body | 8 | 30 |
| Callout | 1 | 100 |
Slide Keywords
Download unlimited PowerPoint templates, charts and graphics for your presentations with our annual plan.
DOWNLOAD