Slide 4 of 4 from Bar Chart Template for PowerPoint
6195-01-bar-chart-4
Grouped Bar Chart for Financial Projections
- Chart
- Bar Vertical
- Financial Summary Slide
- 16:9
- 100% Editable
What’s on This Slide
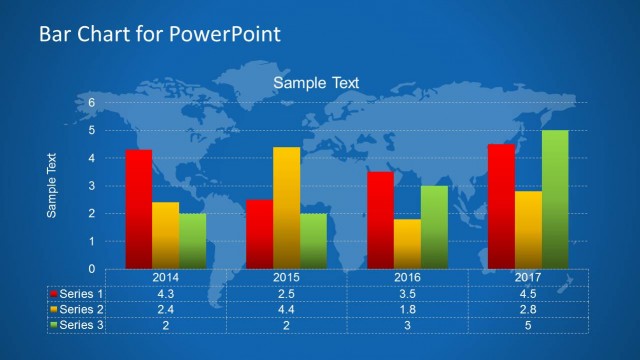
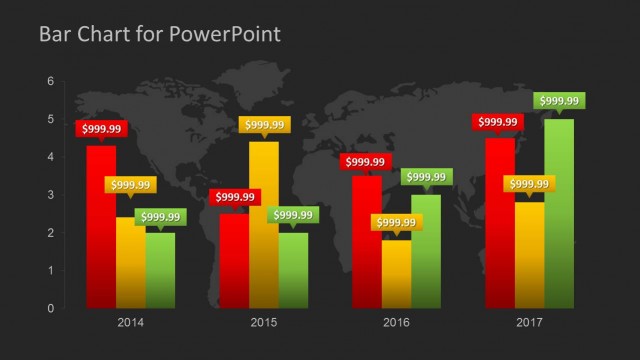
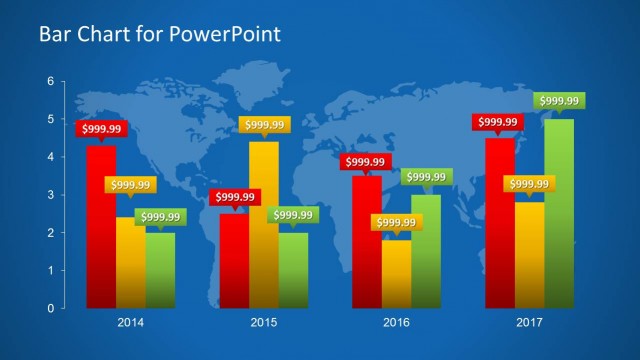
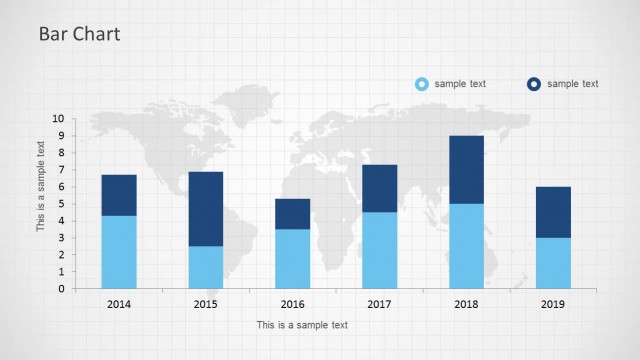
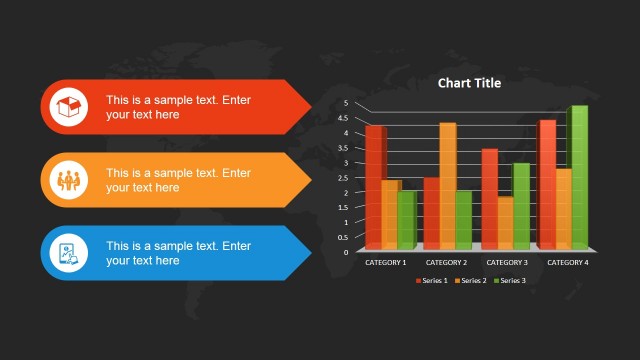
The layout features a grouped bar chart overlaid on a dark world map background. Three series of vertical bars represent data for the years 2014 to 2017, with each series colored distinctly: red for Series 1, yellow for Series 2, and green for Series 3. The chart includes a vertical axis for values ranging from 0 to 6, and a horizontal axis for the years. Text placeholders are present for the chart title and sample data labels, positioned at the top and within the bars, respectively. The overall composition emphasizes the data visualization against the map backdrop.
How to Use It
This layout serves as a data visualization tool for presenting financial projections or comparisons across multiple categories. It fits well in a presentation sequence following an analysis or overview slide, providing a clear visual representation of trends over time. Suitable for business scenarios such as quarterly financial reviews, performance assessments, or management reporting, it effectively communicates complex data in a digestible format.
Text Placeholders & Capacity
Keep your copy within these limits so it fits without resizing. Data labels can accommodate short values, roughly 5 characters each.
| Placeholder | Count | Max characters (approx.) |
|---|---|---|
| Chart title | 1 | 20 |
| Data label | 12 | 5 |
| Item heading | 3 | 10 |
Slide Keywords
Download unlimited PowerPoint templates, charts and graphics for your presentations with our annual plan.
DOWNLOADReturn to Bar Chart Template for PowerPoint.