Slide 6 of 7 from Income Statement PowerPoint Template
6151-02-income-statement-6
Bar Chart Presentation Slide
- Chart
- Bar Horizontal
- Financial Summary Slide
- 16:9
- 100% Editable
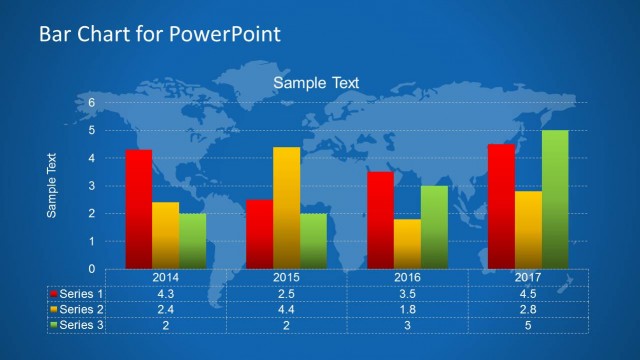
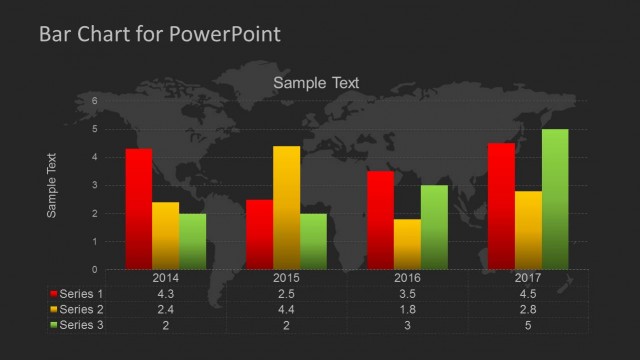
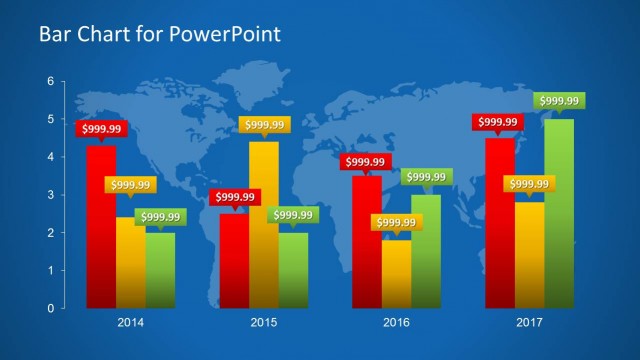
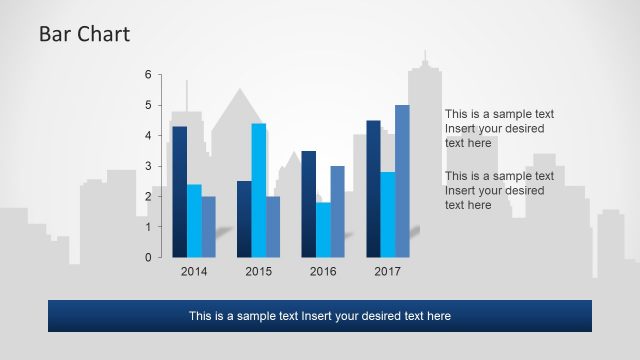
The Bar Chart with World Map Background slide from the Income Statement PowerPoint Template provides a clear financial summary using editable slides that combine data visualization with a global context. This slide layout is well-suited for business presentations focused on financial performance reviews, budget comparisons, and annual revenue trends, featuring vector icons and customizable elements to enhance clarity in corporate presentations.
What’s on This Slide
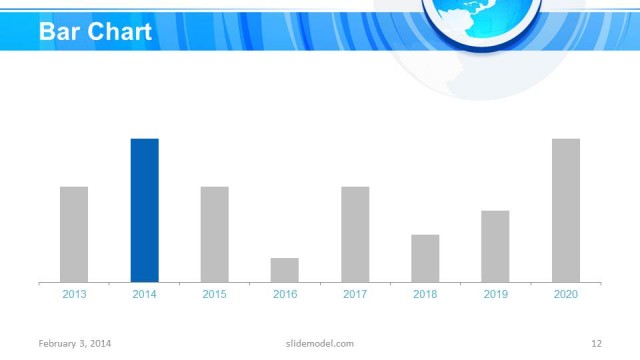
The layout features a bar chart positioned centrally, displaying data across five years from 2014 to 2019. Each bar is divided into two segments, with the upper segment in dark blue and the lower segment in light blue. The chart is set against a light world map background, which occupies the entire slide. Text placeholders are present at the top for the title and at the bottom for axis labels, with additional sample text placeholders below the bars. The overall composition emphasizes the chart while maintaining a clear visual hierarchy.
How to Use It
This layout serves as a data visualization tool, ideal for presenting financial metrics or performance comparisons over time. It fits within a presentation sequence that includes revenue and expense analysis, making it suitable for finance or management discussions. This slide can be used to illustrate trends, highlight growth, or compare different financial periods, effectively communicating key insights to stakeholders.
Text Placeholders & Capacity
Keep your copy within these limits so it fits without resizing. Node labels can accommodate roughly 10 characters each.
| Placeholder | Count | Max characters (approx.) |
|---|---|---|
| Chart title | 1 | 20 |
| Axis label | 2 | 15 |
| Item heading | 5 | 10 |
| Item body | 5 | 10 |
Slide Keywords
Download unlimited PowerPoint templates, charts and graphics for your presentations with our annual plan.
DOWNLOADReturn to Income Statement PowerPoint Template.