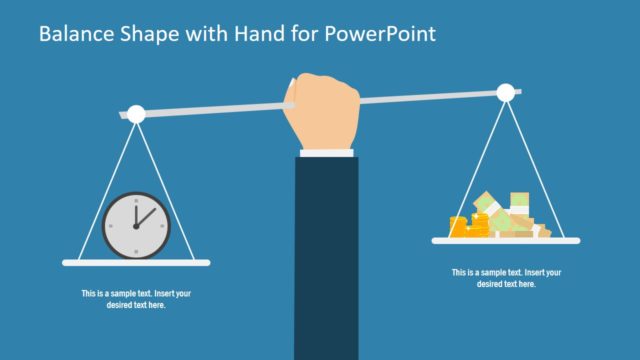
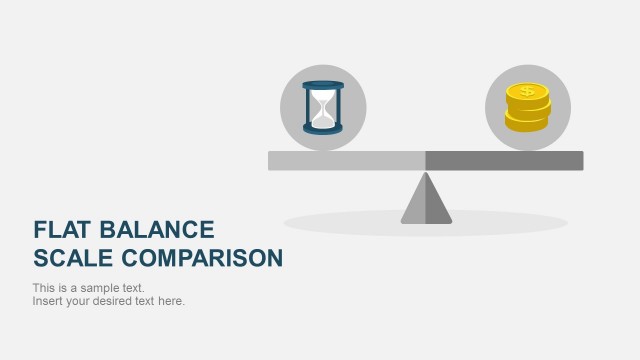
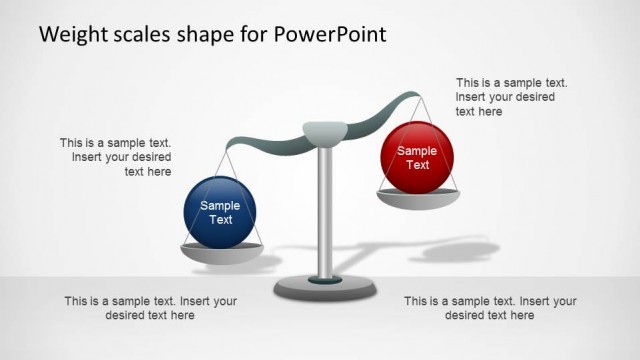
Balance & Equilibrium Template for PowerPoint is a presentation design template for Microsoft PowerPoint containing a balance shape that let you make slides with comparison between two products, features or services. You can also use this balance and equilibrium slide design for PowerPoint to represent different business concepts and theories like the Adam’s Equity Theory.
What’s inside this template
Example presentation scenarios
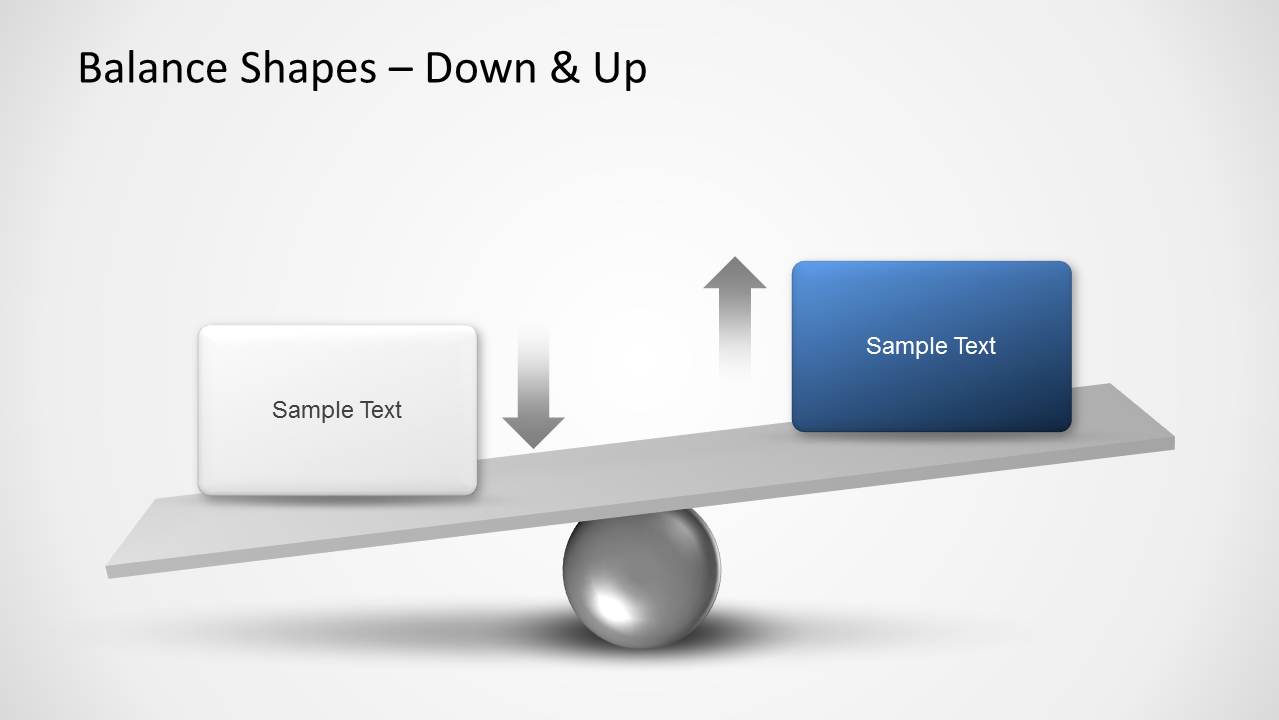
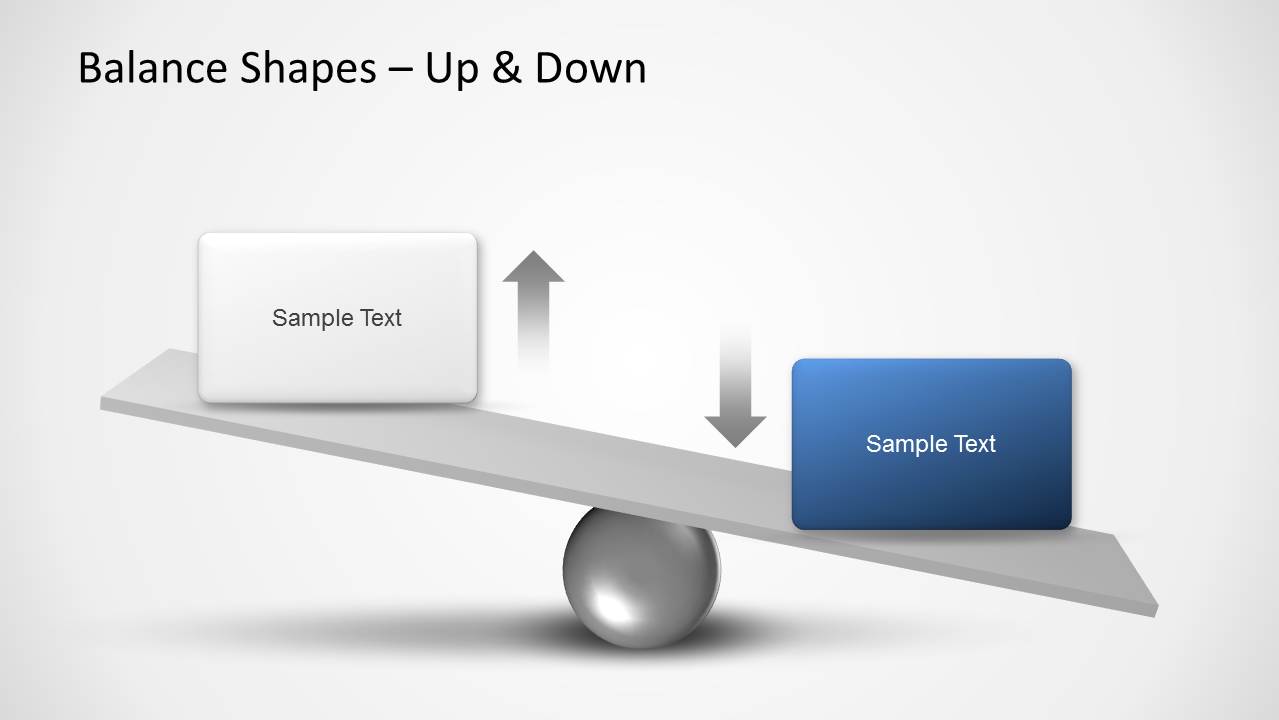
- A strategy consultant can use the tilted balance slides to compare the advantages and constraints of two business options before recommending a decision.
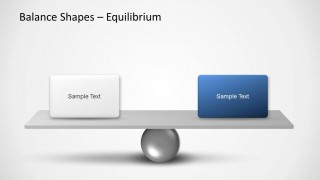
- An HR presenter can use the equilibrium slide to explain equity, fairness, or workload distribution between two employee groups or policy outcomes.
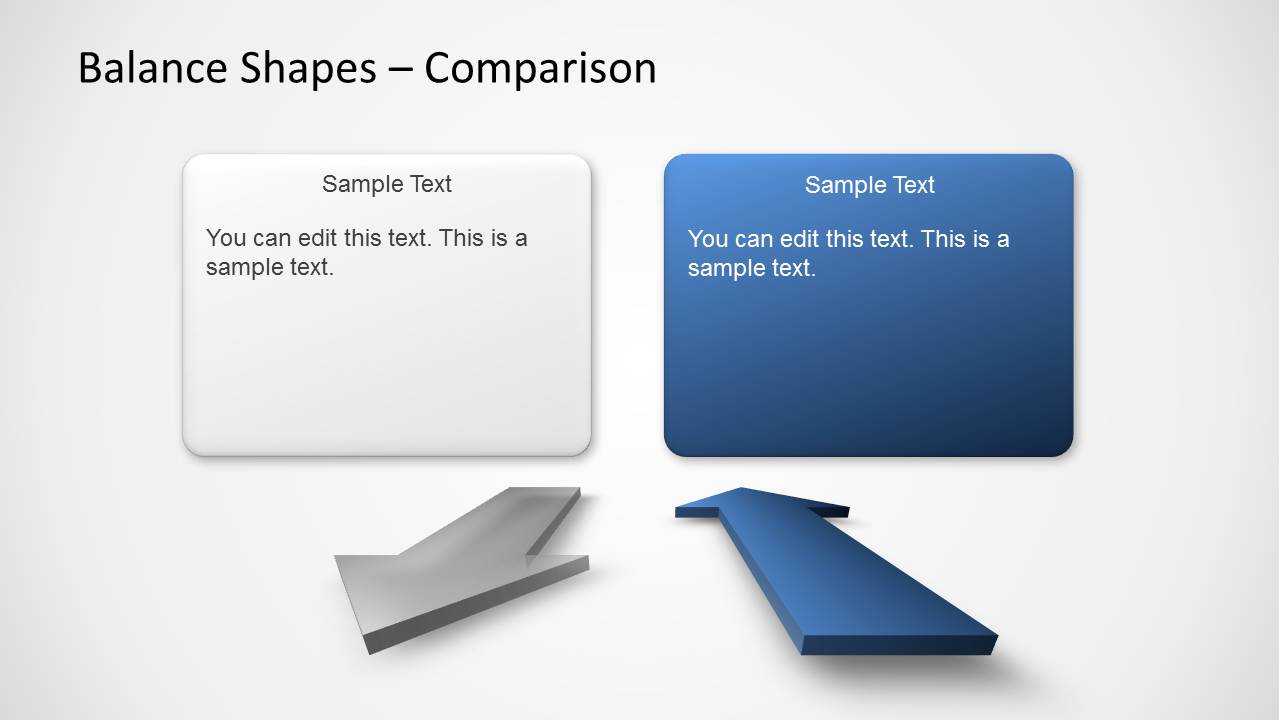
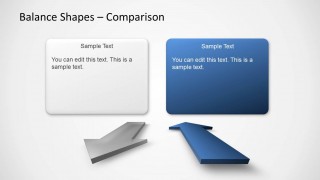
- A project manager can use the comparison cards slide to show competing priorities, such as cost versus quality, with short text blocks under each side.
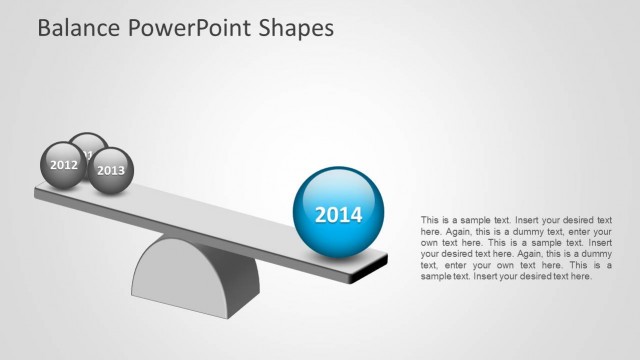
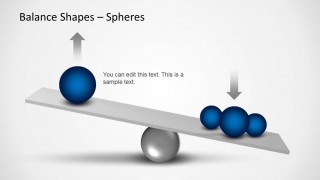
- A trainer can use the spheres slide to explain how several smaller factors can outweigh one large factor in risk, effort, or decision analysis.
Features
- 100% editable presentation template
- Compatible with Microsoft PowerPoint and Google Slides
- Scalable vector shapes, icons and illustrations
- AI-Ready for Microsoft Copilot and Claude
- Instant access and download
Frequently asked questions
Q: How should a presenter frame the message with the balance metaphor?
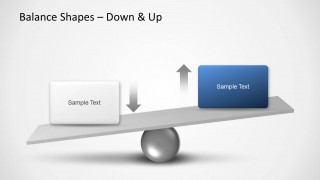
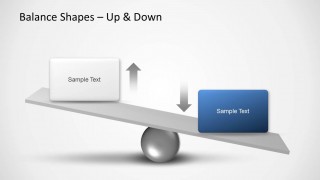
A: Start by naming what each side of the balance represents, then explain why the beam is tilted or level. Use Slide 1 or Slide 2 for an imbalance, Slide 3 for parity, and Slide 4 when both sides need supporting text. Keep labels short so the audience reads the metaphor before the explanation.
Q: Who is this template best suited for in a business presentation?
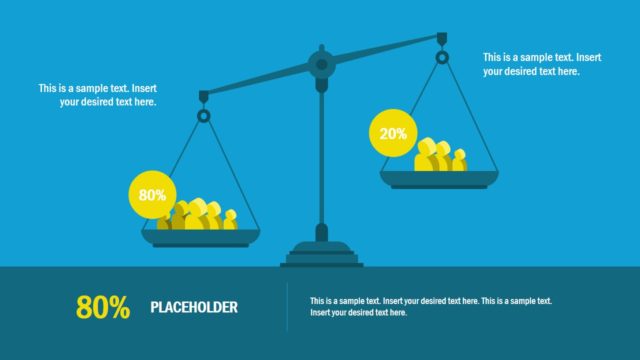
A: This template fits presenters who need to explain tradeoffs, fairness, competing priorities, or decision pressure without building a data-heavy model. Consultants, managers, HR teams, and educators can use the balance scale and comparison card layouts to make abstract ideas like equity, workload, risk, or value easier to discuss.
Q: Why do the balance beam and sphere visuals help the audience understand the comparison?
A: The seesaw metaphor turns an abstract comparison into a spatial judgment: higher, lower, equal, heavier, or lighter. Directional arrows clarify movement, while the sphere slide shows that one large item can be compared against a group of smaller items. This makes the logic visible before the presenter adds detail.


Balance & Equilibrium Template for PowerPoint
5-slide PowerPoint presentation template with balance scale metaphors, comparison cards, and sphere weight diagrams
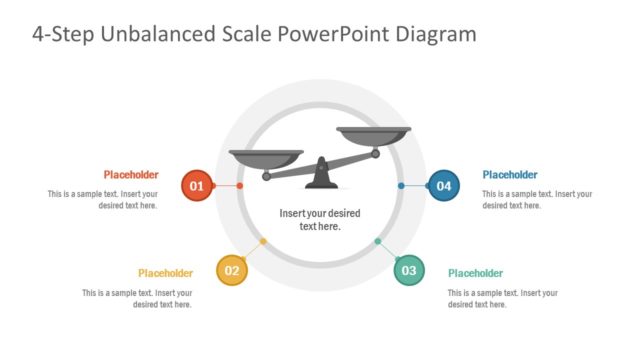
Balance & Equilibrium Template for PowerPoint is a 5-slide business diagram template for Microsoft PowerPoint. It shows tilted balance shapes, an equilibrium scale, two-sided comparison cards, directional arrows, and sphere weight metaphors. Business presenters can compare options, show tradeoffs, or explain balance, equity, and problem-solving concepts.


 Loading...
 Microsoft PowerPoint
  Microsoft Copilot
  Claude for PowerPoint
 Other formats supported
Subscribe today and get immediate
access to download our PowerPoint templates.