Animated Funnel Diagram for PowerPoint
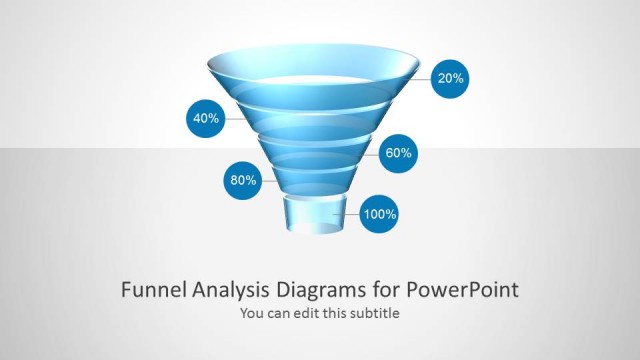
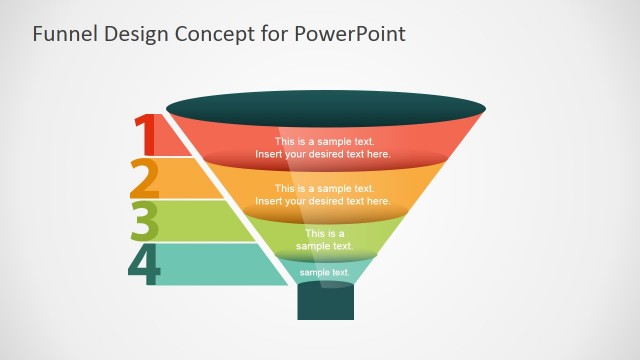
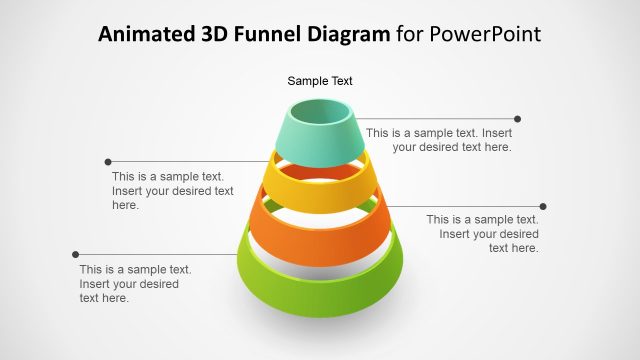
The Animated Funnel Diagram for PowerPoint is a four-level chart to help users make professional-looking presentation. The funnel diagram is an analysis technique commonly use for modeling sales revenue and lead generation. It is usable in other application where the goal is to progressively narrow-down information towards objective target. The funnel diagram is helpful to forecast a startup or complex data analysis of a company. This powerful presentation can help many industries; however, it has been vastly used in online digital marketing.
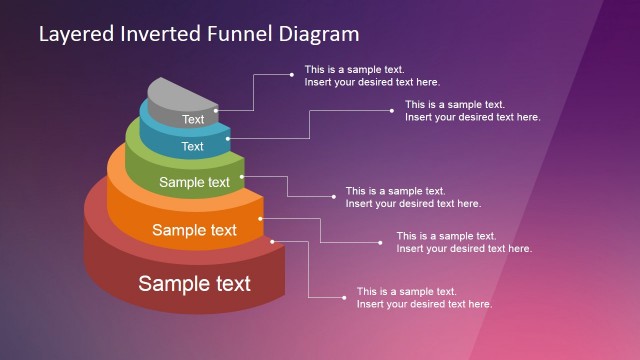
Basically, the Funnel Diagram shows data transformation which starts at 100% and reduces to very small percentage. It visually illustrates where the major downfall occurred. This helps identify and mitigate risks involved in the process pipeline and improve overall sales quality.
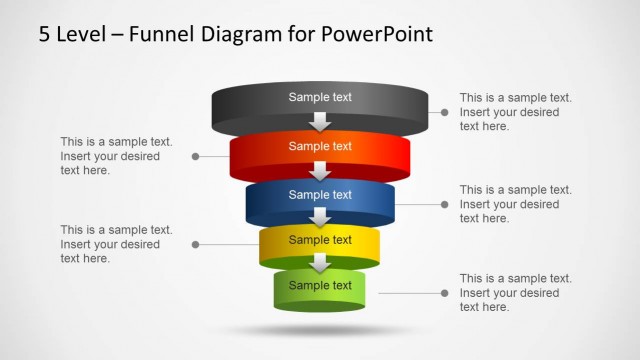
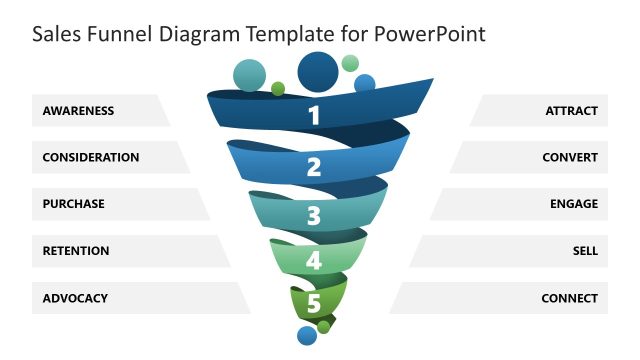
The Animated Funnel Diagram for PowerPoint is an ideal to communicate organizational sale process to new team members. For example, this graphical tool displays global customer base at the top level who are the target market. The second layer in decreasing order is shows extraction of interested leads/buyers, the potential interested customer. The next step displays an affirmative response and a negotiation phase narrowing it down to closure where customer pays.
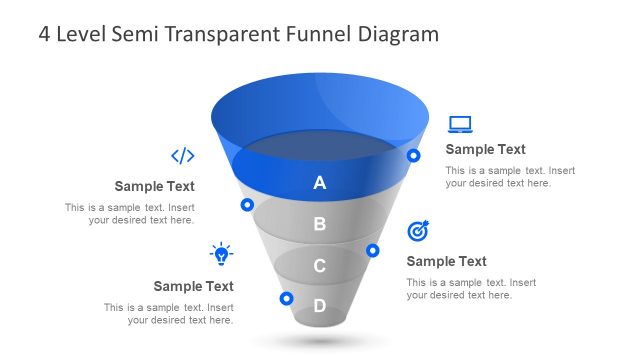
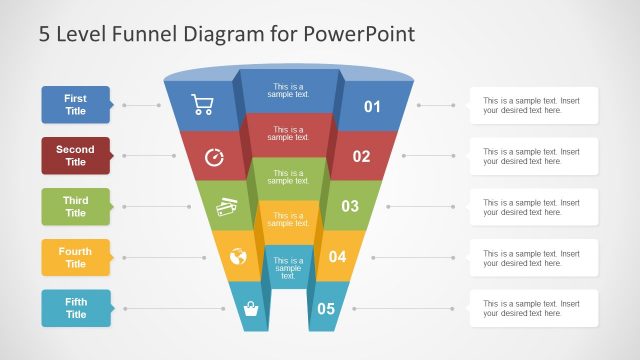
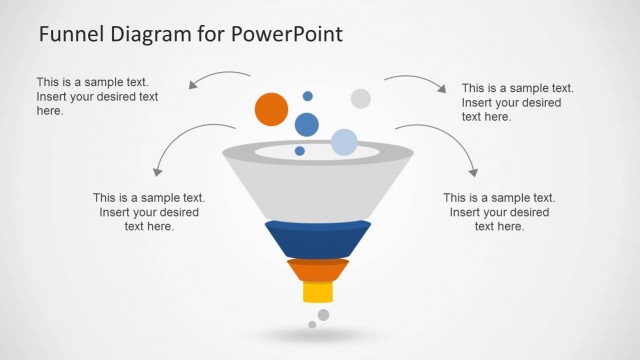
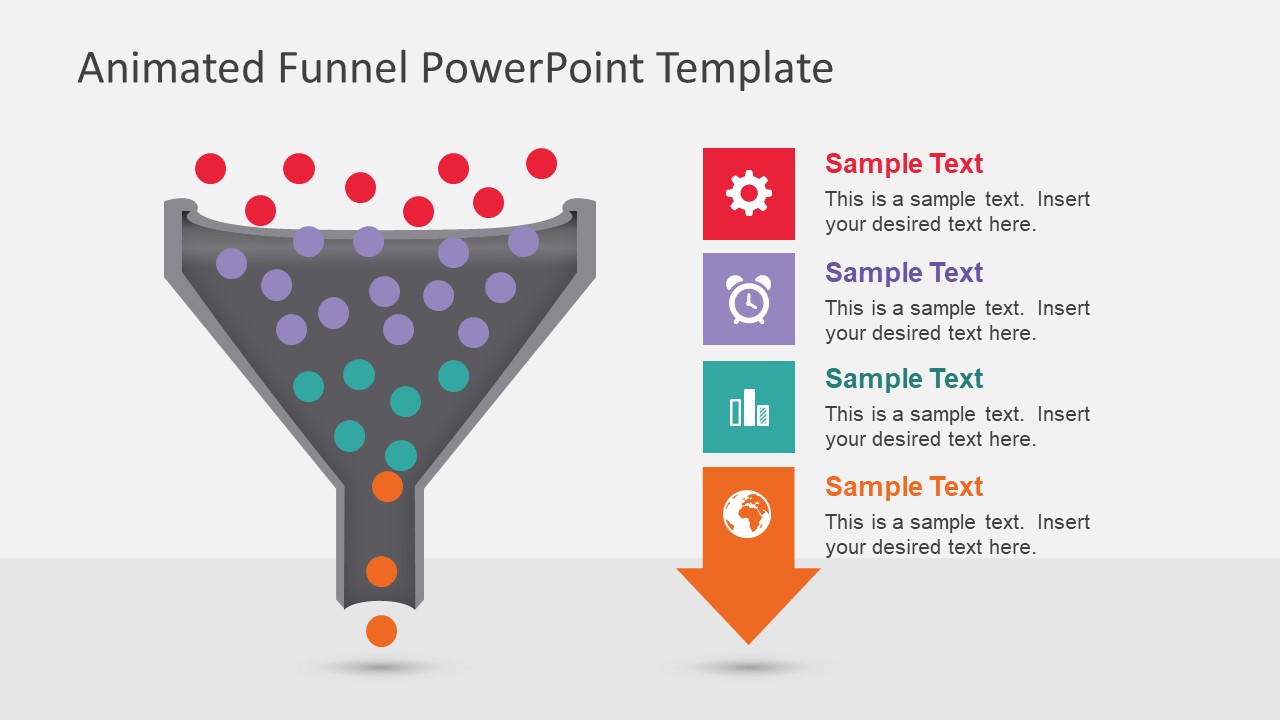
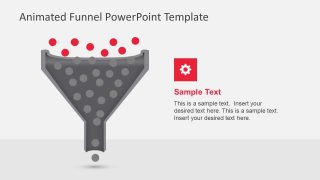
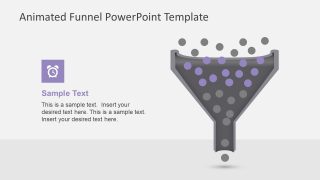
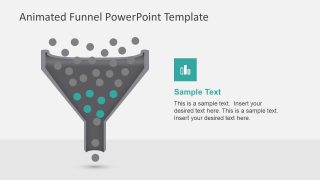
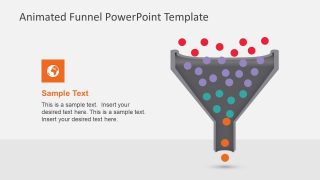
In this presentation, there are 5 attractive versions of funnel diagram. This PowerPoint diagram shows 4 levels of sales process flow. The circle icons represent data transformation through a management analysis process. The stages have PowerPoint icon infographics such as gear, alarm clock, bar chart and globe. The template contains 4 individual slides highlighting each layer with editable text placeholders. Further, each layer of funnel chart is an independent shape, enabling users to modify funnel components. Each steps of the funnel transition is an animation, showing entropy movements withing the circles that represent the particles in the section.
The Animated Funnel Diagram for PowerPoint demonstrate unique sales strategy presentation. The colorful layers can attract positive engagement from the audience. Also, find more professional PowerPoint Diagram templates with various funnel chart designs in SlideModel Gallery.


You must be logged in to download this file.
DOWNLOAD- Category
- Diagrams
- Rating


 Loading...
- Size
- 16x94x3
- Item ID
- 7446-01
- Colors
Subscribe today and get immediate
access to download our PowerPoint templates.