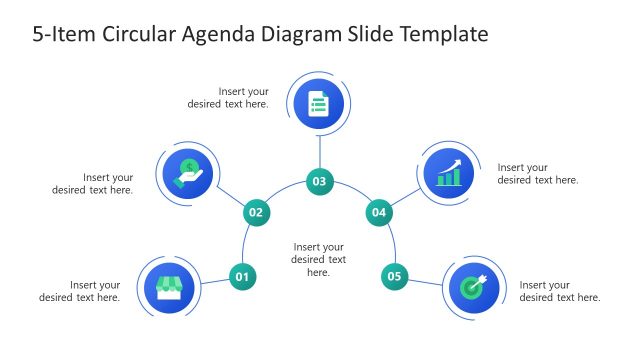
5-Item Bridge Concept Diagram PowerPoint Template
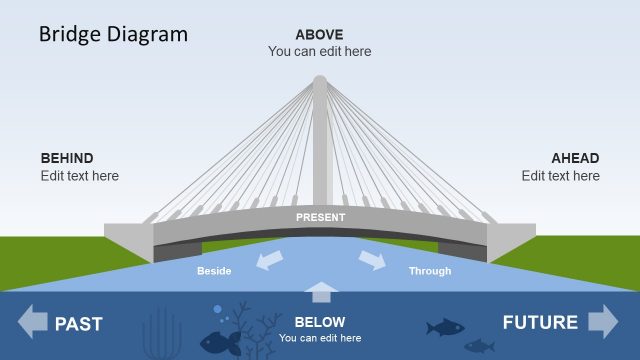
Visually demonstrate the steps in the transformation process with our 5-Item Bridge Concept Diagram PowerPoint Template. A bridge diagram is used where there is a need to showcase the current and expected future states. This is also useful in discussing market gaps and ways to cover the gap, improving the company’s position. This template diagram lets professionals structure change management, strategic planning, process improvement, and digital transformation procedures. We have created this simple and compelling diagram for professionals, marketers, talent managers, business developers, and product managers. They can discuss the steps to improve their business position.
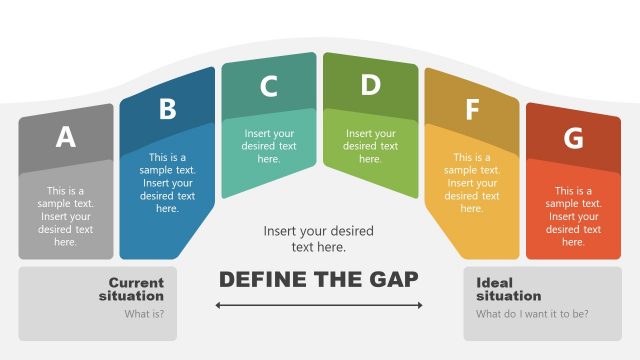
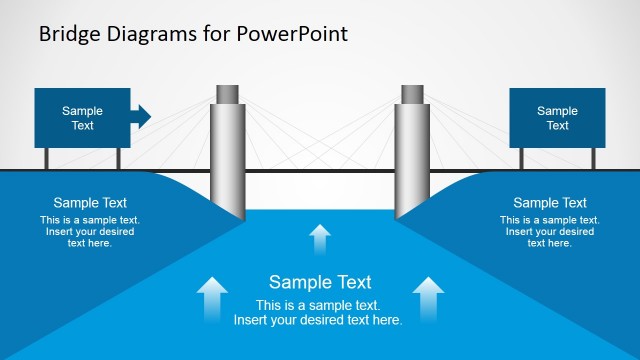
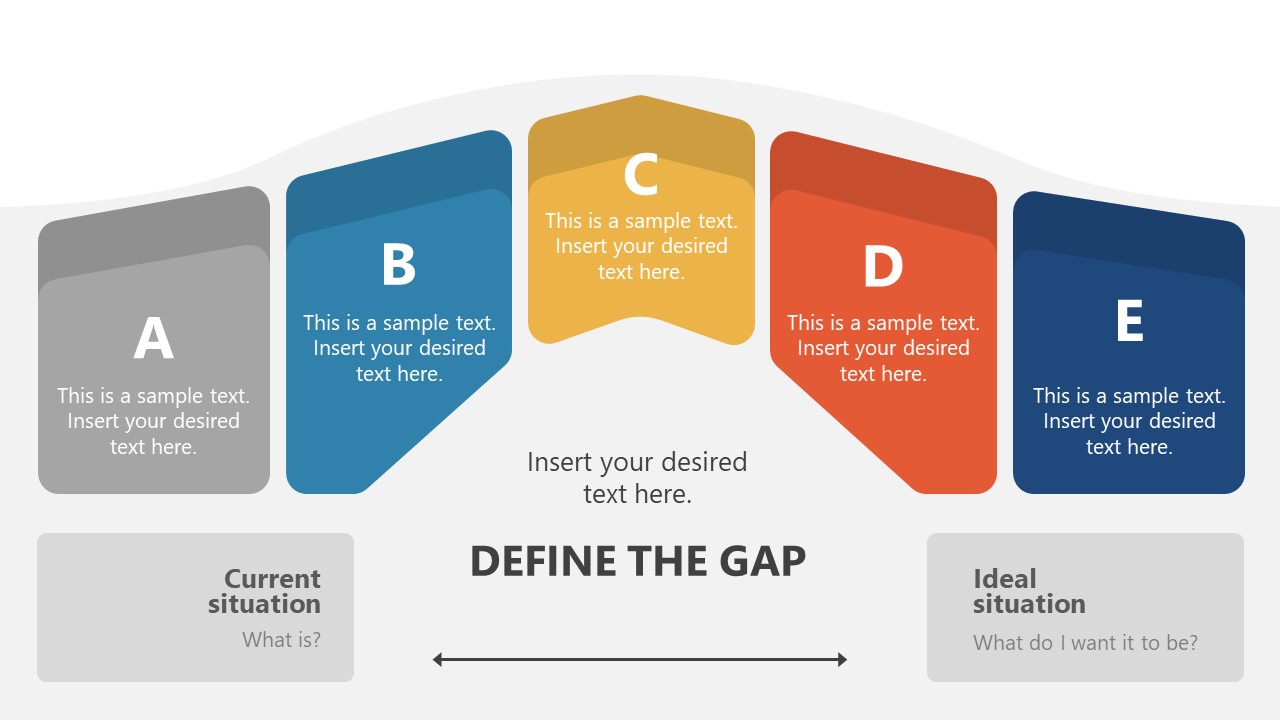
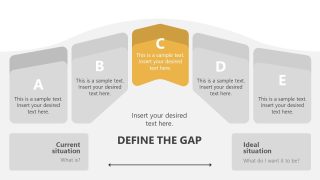
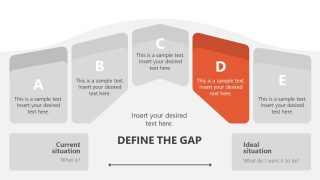
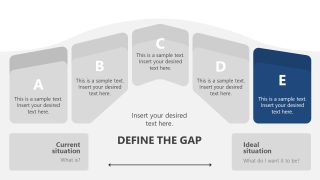
The 5-Item Bridge Concept Diagram PowerPoint Template shows a bridge diagram showing five segments: A, B, C, D, and E. The steps indicate the process steps and stages of the strategic components. The left side represents the current state of the product or business process. The middle section C describes the transition point, while the right side shows the expected future state, idea, or goal. There is a central, large text region titled Defining the Gap, where professionals can mention the insights or provide business solutions.
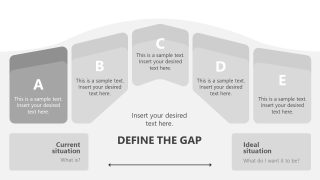
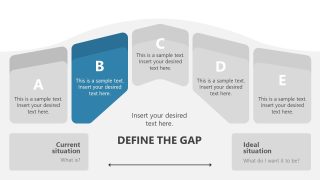
The first slide has colorful components, while the remaining five slides show a spotlight effect to focus on one element at a time using a color highlight. This allows project managers to visualize the step-wise approach to project management and bridge the market gap. Alternatively, you can edit our 6-Item Bridge Concept Diagram PowerPoint Template to showcase more segments or stages in your strategic business plans. Users can customize the PPT design of this concept diagram template with Google Slides and Keynote. Modify the template’s shapes, text placeholders, and colors based on your specific requirements. Download the 5-item bridge concept template and personalize it today!
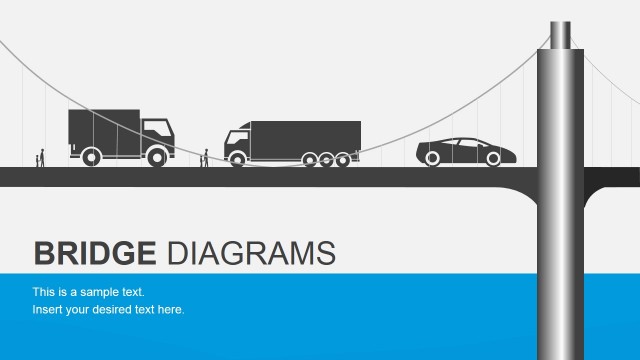
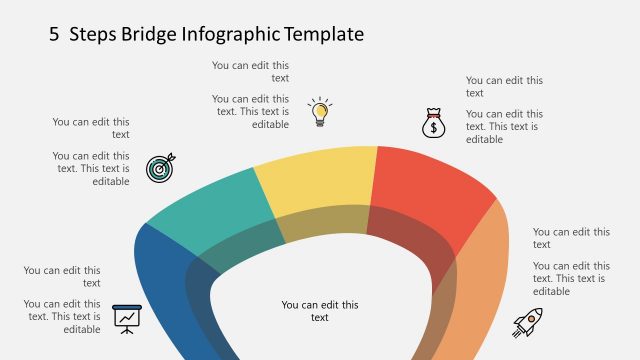
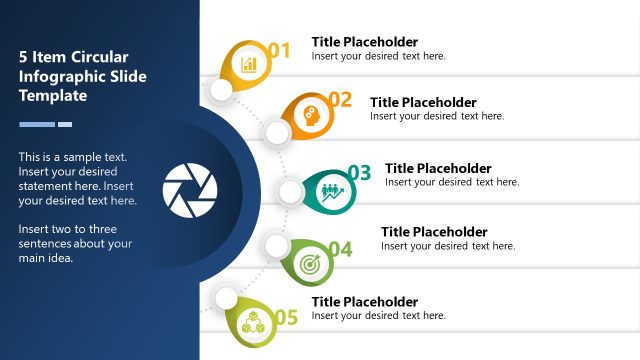
Alternatively, you can download other bridge PPT templates for Microsoft PowerPoint, Google Slides and Canva presentations.


You must be logged in to download this file.
DOWNLOAD- Category
- Diagrams
- Rating

 Loading...
- Size
- 16x9
- Item ID
- 23020-01
Subscribe today and get immediate
access to download our PowerPoint templates.