4-Item Circular Arrow Diagram PowerPoint Template
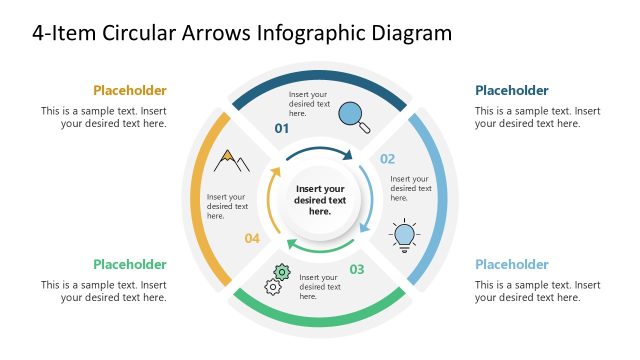
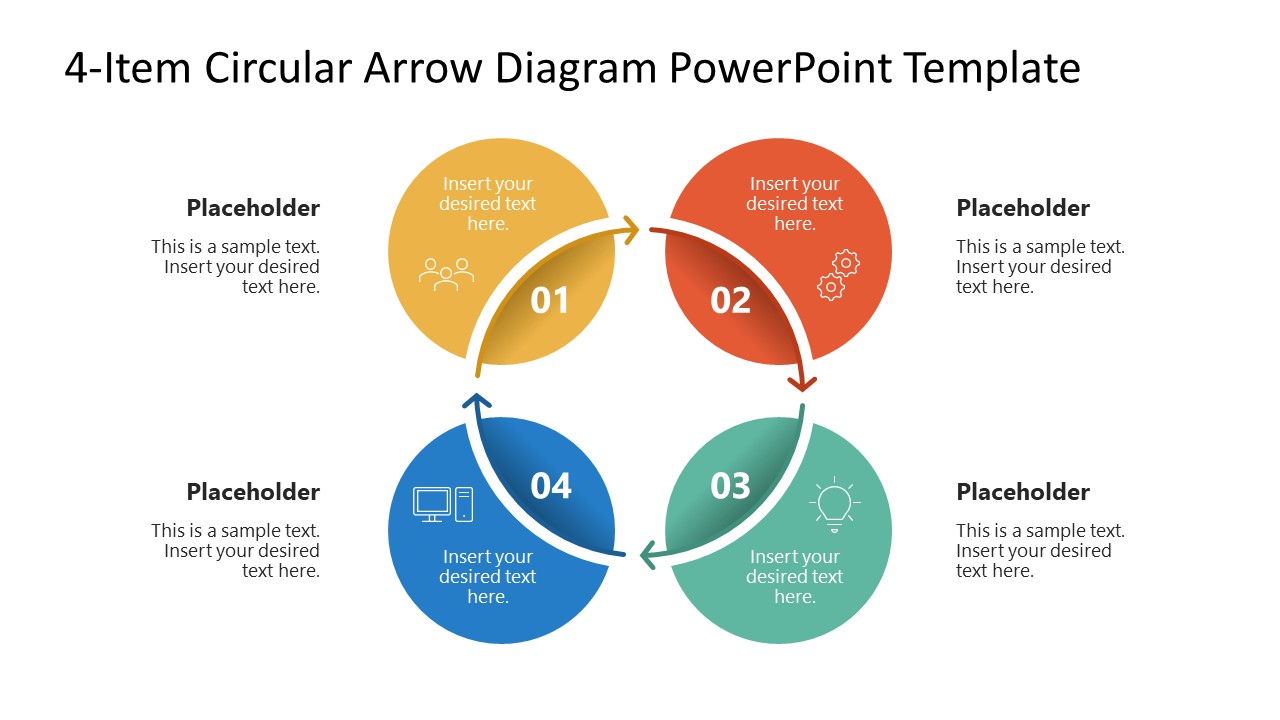
A quarterly cycle chart with four boxes and arrows explains what happens once. It doesn’t explain what happens on repeat, which is the whole point of an operational loop. The 4-Item Circular Arrow Diagram PowerPoint Template gives each phase its own colored node around a closed loop, and its own dedicated slide once the group is ready to focus on it.
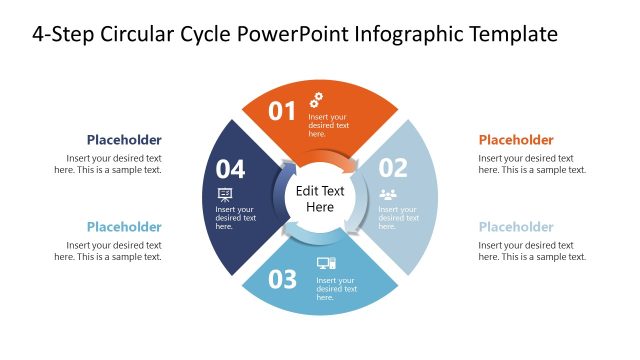
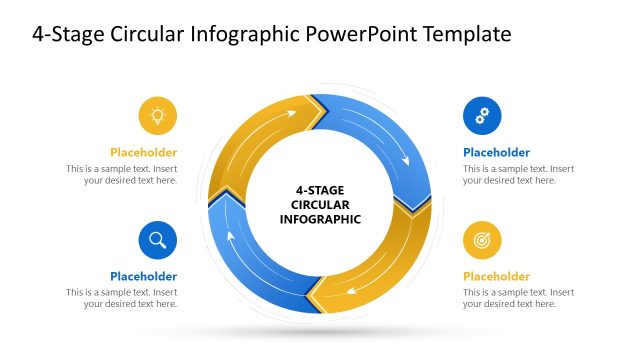
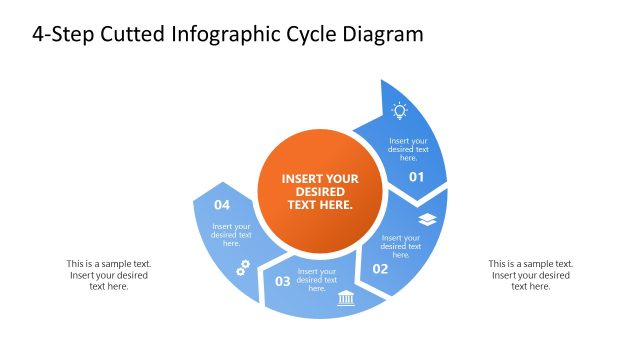
With five slides available on the deck, the main slide showcases the full cycle overview, with four color-coded nodes numbered 01 through 04, connected by curved arrows, with a placeholder heading and two-line description block flanking each side. The following slides focus on each node stage, allowing the presenter to explain further information while the rest of the nodes are grayed out.
Running a quarterly audit review, an operations manager can open on the Full Cycle Overview to set the loop, then move straight to the Step 4 Focus slide to show how post-audit findings feed back into next quarter’s planning phase. Walking engineering stakeholders through an iterative release process, a product team lead can step through all four focus slides in sequence, ending on Step 4 to show exactly how user feedback loops back to change what happens at Step 1.
Recolor the four nodes or swap the icon set to fit a different business model or supply chain process; the loop structure stays intact either way. Grab the 4-item circular arrow diagram template and give your next continuous-improvement review a shape that actually loops.







You must be logged in to download this file.
DOWNLOAD- Category
- Process Diagrams
- Rating

 Loading...
- Size
- 16x9
- Item ID
- 23749-01
- Colors
Subscribe today and get immediate
access to download our PowerPoint templates.