3×3 Diagram for PowerPoint with Harvey Balls
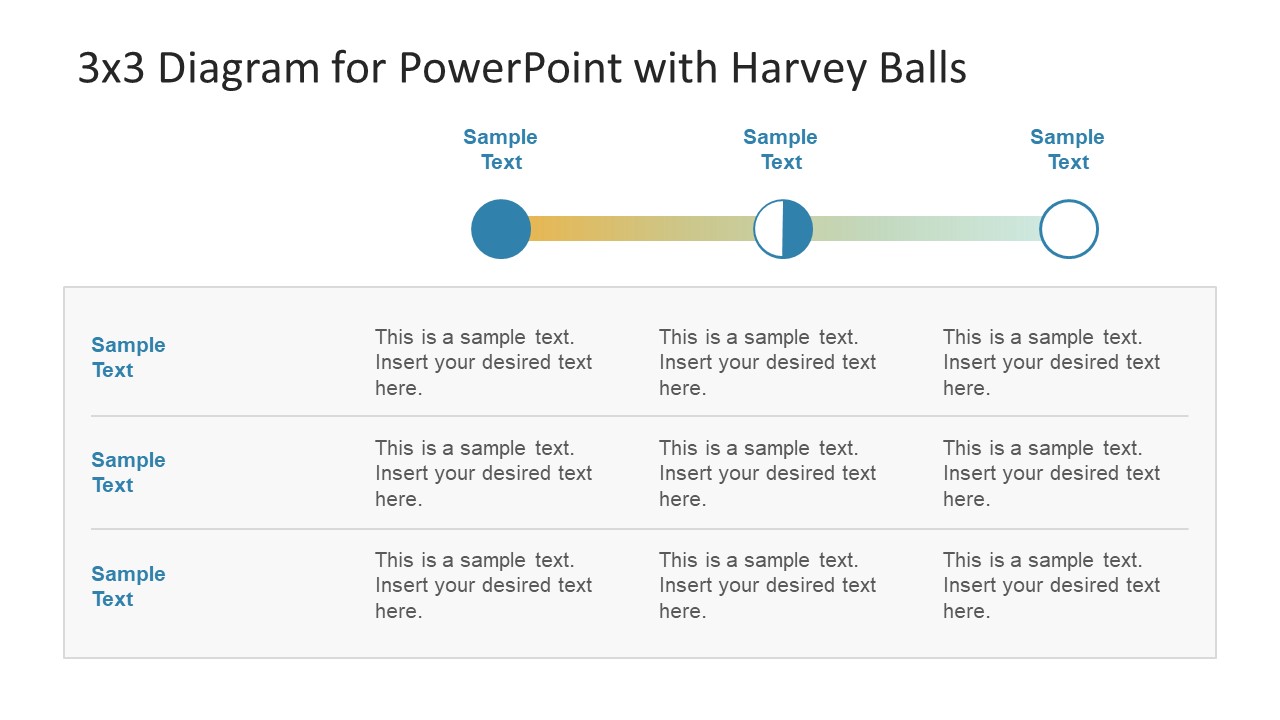
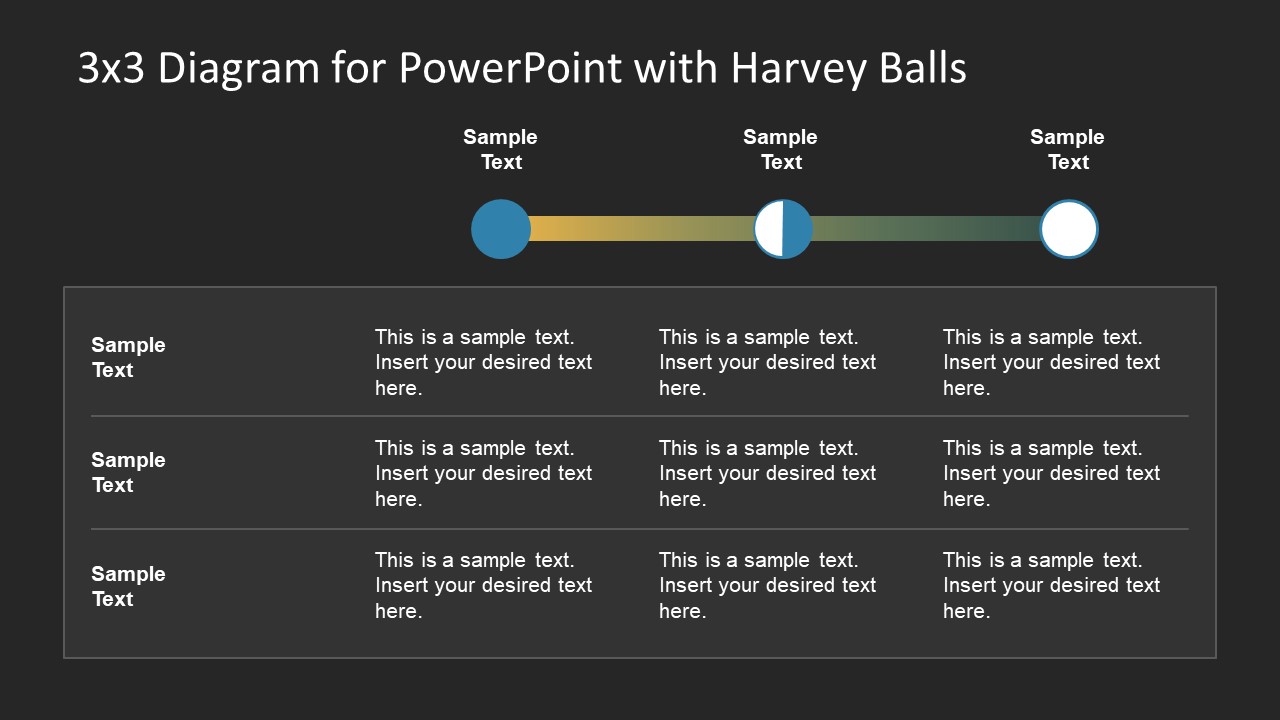
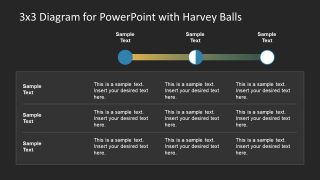
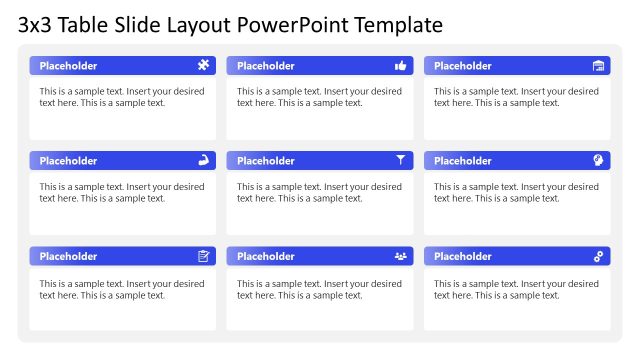
3×3 Diagram for PowerPoint with Harvey Balls – a toolkit for visual communication of qualitative data. The most common use of Harvey Balls is in comparison tables and charts. They help show the features or product’s level of meeting specific criteria. This PowerPoint contains 3X3 table with the variation of Harvey Balls representing visual transition of process. The editable template shows this transition by change in color of circular icons and the connecting bar. The Harvey Balls PowerPoint template also has two background variations of this template i.e. white and black. Further, the rows and columns in this template are customizable. Therefore, users can add or delete the rows and columns as necessary. Similarly, in the horizontal transition of Harvey balls, add or remove circular icons according to table.
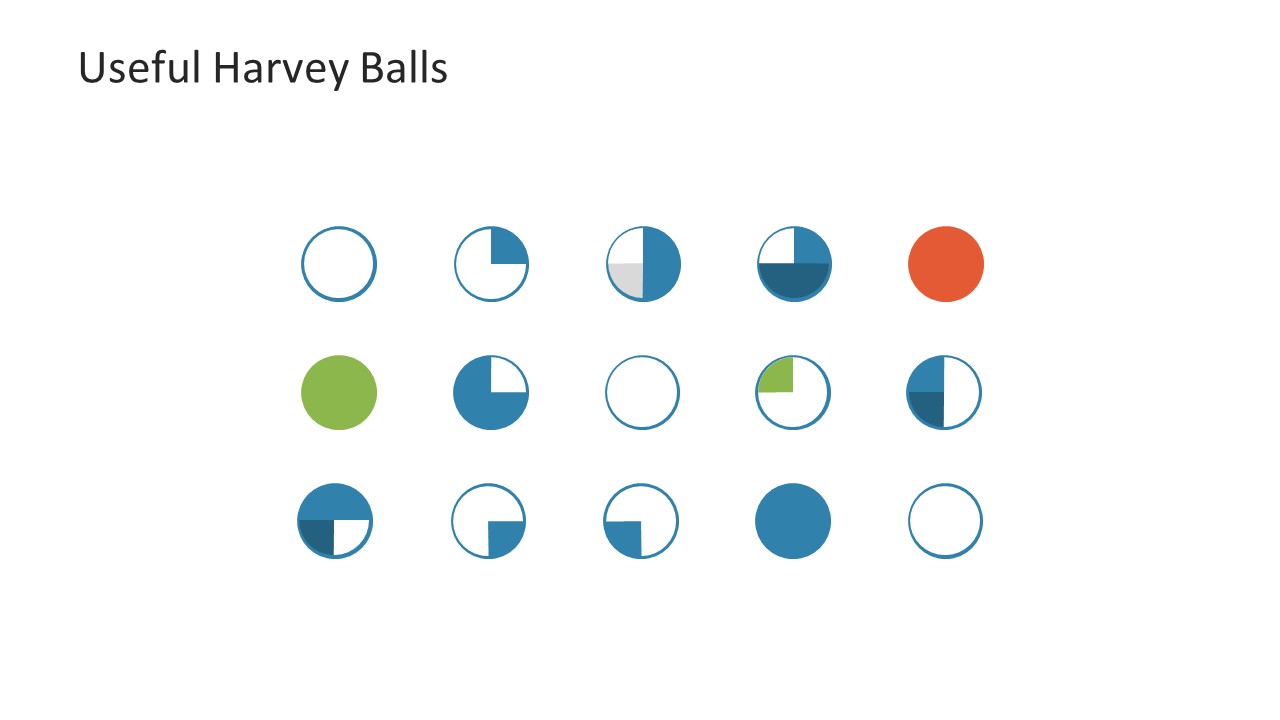
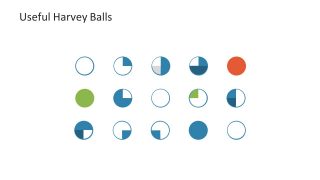
The simple business template of 3X3 Diagram for PowerPoint with Harvey Balls has a useful slide of 15 icons. These are the circular Harvey Balls in PowerPoint have color variations and portions to use in any slide or presentation. These circular ideograms are graphical representation of information which cannot be shown through numerical data charts. Harvey Balls are an easy way to summarize the information of in comparison tables. For example, an online application company display features list of its personal use vs. commercial software. Here, Harvey Balls can present the level of functions available in each. This PowerPoint diagram is suitable for project management professionals to present tracking, Gantt chart and continuous improvement.
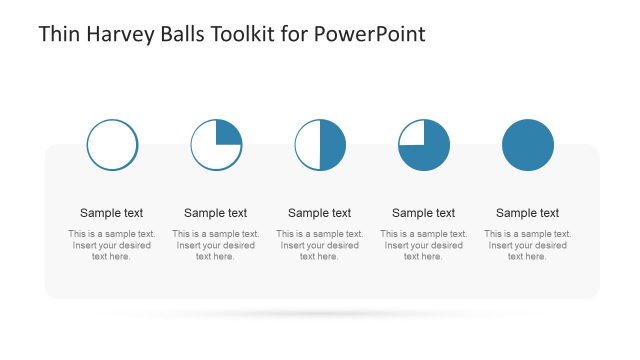
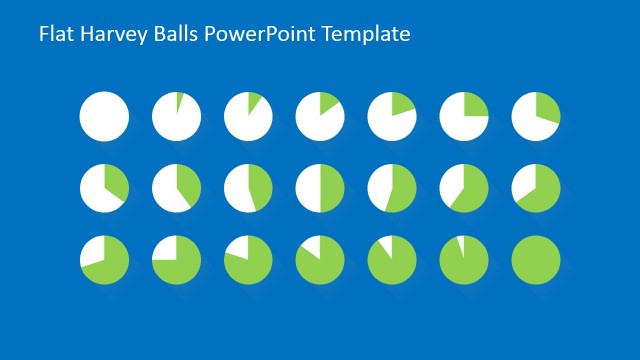
The creative small icons of Harvey Balls in 3X3 diagram of PowerPoint are good for presenting percentage completion. Alternatively, these can assist in providing a star rating for a product or service. In reporting and analysis, the Harvey ball icons can demonstrate KPIs of the project. This PowerPoint template diagram is useful in number of topics such as, business production, sales and marketing. The visual illustration of data always helps audience remember the message.
