Slide 4 of 5 from 3D Cylinder Chart Concept for PowerPoint
6020-3d-cylinder-chart-concept-wide-4
3D Concept Cylinder Chart - Up Trend
- Chart
- Bar Vertical
- Evaluation Slide
- 16:9
- 100% Editable
The 3D Concept Cylinder Chart - Up Trend slide from the 3D Cylinder Chart Concept for PowerPoint template offers a clear visual tool for illustrating growth trends and comparing performance metrics. Designed with editable shapes and a gradient of blue cylinders, this slide enhances business presentations by effectively communicating statistical data and upward trends in a professional slide deck.
About This Slide
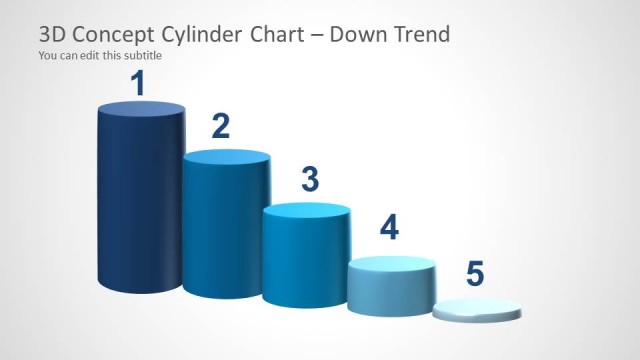
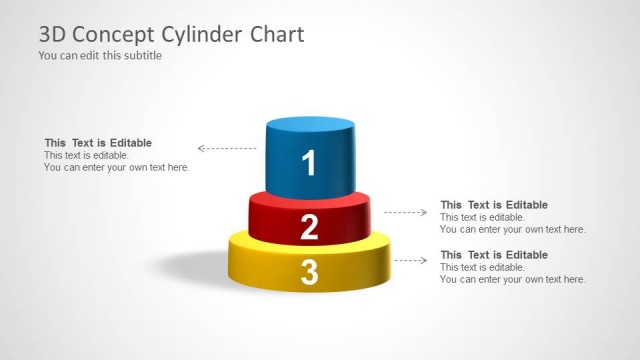
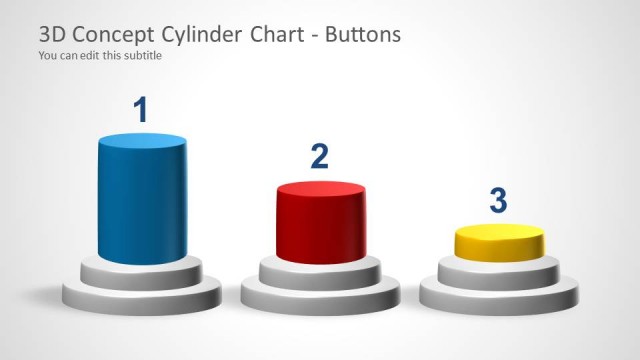
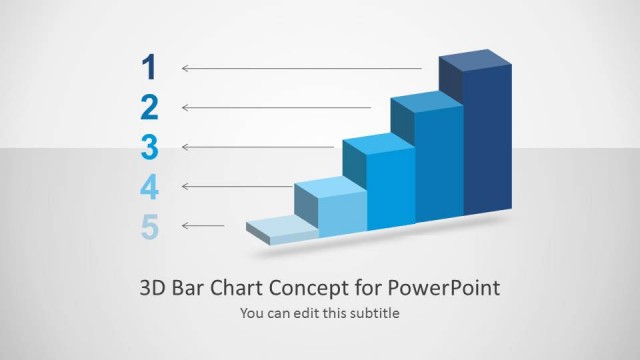
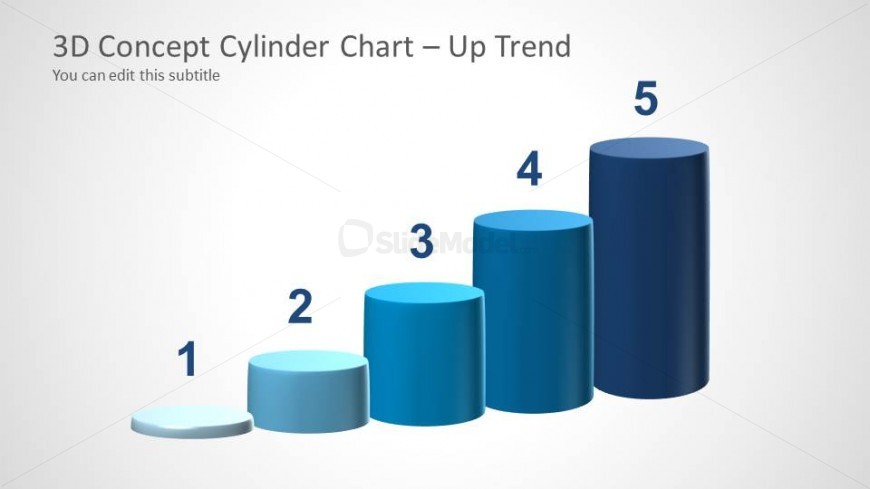
This 3D cylinder shape resembles a vertical, ascending bar graph. There are five segments to this 3D diagram template and a different color for each.
What’s on This Slide
The layout features five 3D cylinders arranged in ascending order from left to right. Each cylinder represents a different value, with the smallest on the left and the largest on the right. The cylinders are colored in varying shades of blue, creating a gradient effect. Above the cylinders, there is a title placeholder aligned to the left and a subtitle placeholder directly beneath it. The background is light gray, enhancing the visibility of the cylinders. The overall composition is clean and focused on the data representation.
How to Use It
This layout serves as a data visualization tool to illustrate trends or comparisons among five distinct values. It is suitable for business presentations where showcasing growth, performance metrics, or statistical data is essential. This slide fits well after problem identification slides, providing a visual representation of positive trends. It can be used in various contexts, such as sales growth, project progress, or market analysis, to effectively communicate upward trends in data.
Text Placeholders & Capacity
Keep your copy within these limits so it fits without resizing. Node labels can accommodate single characters, while the title and subtitle have moderate space.
| Placeholder | Count | Max characters (approx.) |
|---|---|---|
| Slide title | 1 | 30 |
| Subtitle | 1 | 50 |
| Item heading | 5 | 1 |