Slide 3 of 5 from 3D Cylinder Chart Concept for PowerPoint
6020-3d-cylinder-chart-concept-wide-3
3D Concept Cylinder Chart for Presentations
- Chart
- Other
- Process Slide
- 16:9
- 100% Editable
The 3D Concept Cylinder Chart slide from the 3D Cylinder Chart Concept for PowerPoint template offers a clear visual method for process visualization and data representation. This slide layout includes editable shapes and vector icons to highlight hierarchical stages or sales performance trends, making it suitable for business presentations and pitch deck templates that require engaging and informative charts.
About This Slide
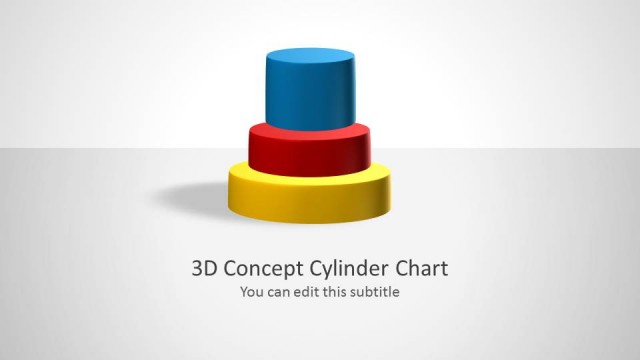
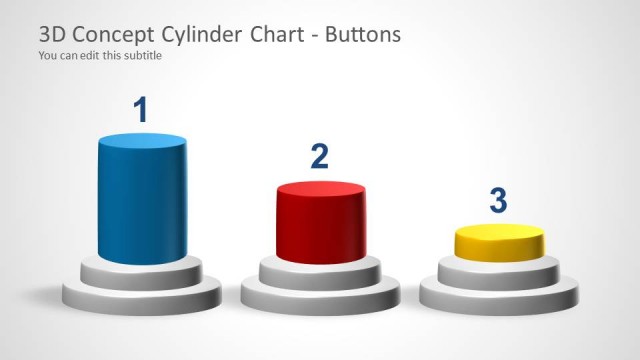
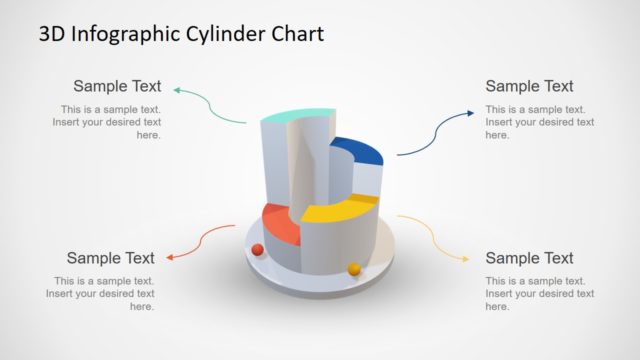
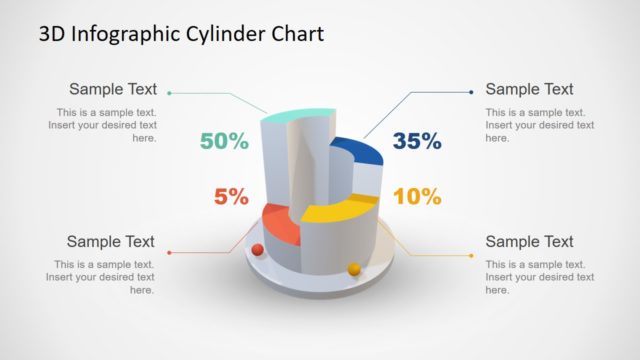
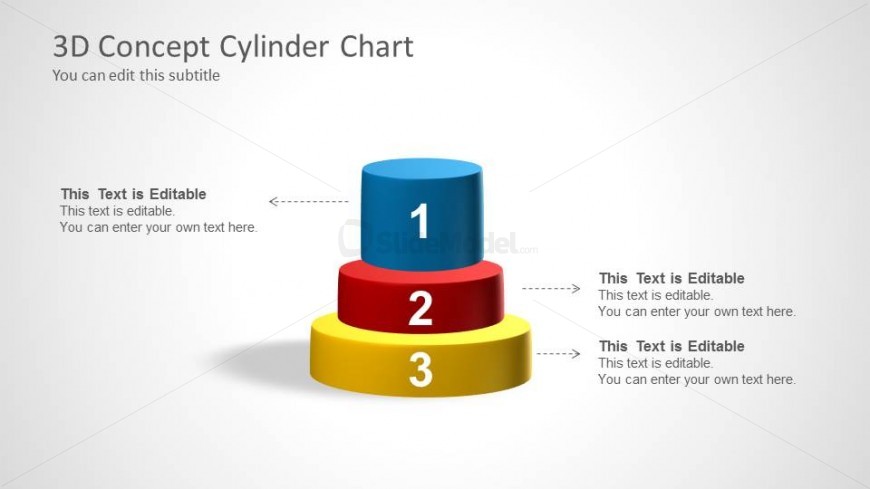
In this slide, you’ll find a three-tier 3D cylinder pyramid. Each of the three layers of the pyramid have their own color and arrows that point to editable text fields.
What’s on This Slide
The layout features a 3D cylinder chart with three stacked cylinders in blue, red, and yellow. The top cylinder is blue, the middle is red, and the bottom is yellow, each labeled with numbers 1, 2, and 3. Arrows point from each cylinder to editable text placeholders positioned to the right. The title is at the top left, with a subtitle below it. The background is light gray, providing contrast to the colorful cylinders. The overall composition is balanced, with clear visual hierarchy and alignment of elements.
How to Use It
This layout serves as a 3D chart to represent hierarchical data or stages in a process. It fits well in presentations that require visualizing data trends or comparisons. This structure is useful for business scenarios such as project phases, sales performance, or product features. It can also be applied in educational contexts to illustrate concepts or processes. The layout is effective for engaging audiences with visual data representation.
Text Placeholders & Capacity
Keep your copy within these limits so it fits without resizing. Node labels can hold about 10 characters each.
| Placeholder | Count | Max characters (approx.) |
|---|---|---|
| Slide title | 1 | 30 |
| Subtitle | 1 | 50 |
| Item heading | 3 | 10 |
| Item body | 3 | 50 |