Slide 2 of 5 from 3D Cylinder Chart Concept for PowerPoint
6020-3d-cylinder-chart-concept-wide-2
3D Concept Cylinder Chart for Presentations
- Chart
- Other
- Evaluation Slide
- 16:9
- 100% Editable
The 3D Concept Cylinder Chart slide from the 3D Cylinder Chart Concept for PowerPoint template offers a clear visual comparison of data points using three distinct cylinders. Ideal for business presentations, this slide layout supports the illustration of performance metrics, project phases, or sales figures with editable shapes and vector icons to enhance clarity in corporate presentations and pitch decks.
About This Slide
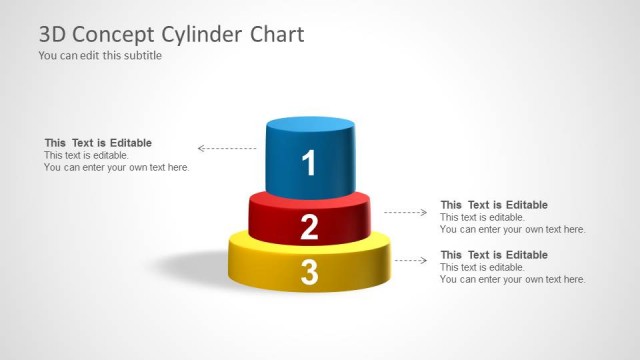
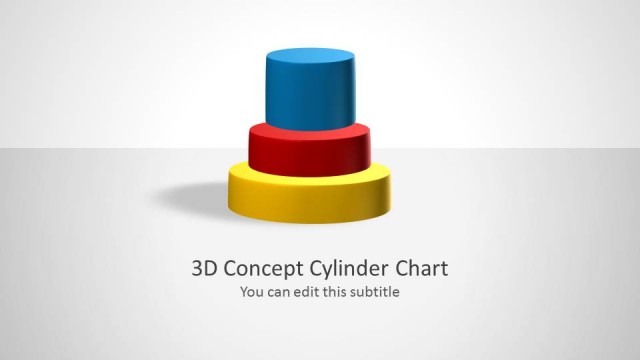
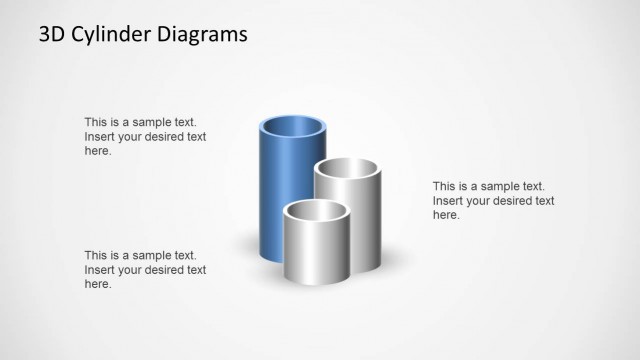
This slide demonstrates three different heights of 3D cylinder buttons that can be used to show different quantities or 1st, 2nd, and 3rd place winners of a competition.
What’s on This Slide
The layout features three 3D cylinders arranged in a row, each on a circular base. The leftmost cylinder is blue, the middle one is red, and the rightmost is yellow. Each cylinder has a number label positioned at the top, indicating their sequence. The cylinders vary in height, with the blue cylinder being the tallest, followed by the red, and then the yellow. A title placeholder is located at the top left, while a subtitle placeholder is beneath it. The background is light gray, contributing to a clean visual hierarchy.
How to Use It
This layout serves as a comparative chart to display data points using 3D cylinders. It fits well after introducing a concept or problem, allowing for a visual representation of different metrics or categories. Suitable for business presentations, it can illustrate sales figures, performance metrics, or project phases. This structure can effectively engage an audience by providing a clear visual comparison of three distinct items or concepts.
Text Placeholders & Capacity
Keep your copy within these limits so it fits without resizing. Node labels can hold short phrases, roughly 3-5 words each.
| Placeholder | Count | Max characters (approx.) |
|---|---|---|
| Slide title | 1 | 30 |
| Subtitle | 1 | 40 |
| Item heading | 3 | 5 |