Slide 5 of 5 from 3D Cylinder Chart Concept for PowerPoint
6020-3d-cylinder-chart-concept-wide-5
3D Concept Cylinder Chart - Down Trend
- Chart
- Bar Vertical
- Evaluation Slide
- 16:9
- 100% Editable
The 3D Concept Cylinder Chart - Down Trend slide from the 3D Cylinder Chart Concept for PowerPoint template offers a clear visual tool for illustrating declining performance metrics. Ideal for business presentations and sales analysis, this slide uses editable shapes and vector icons to depict a descending trend effectively. It supports concise communication in corporate presentations and pitch deck templates by highlighting negative trends with a professional design.
About This Slide
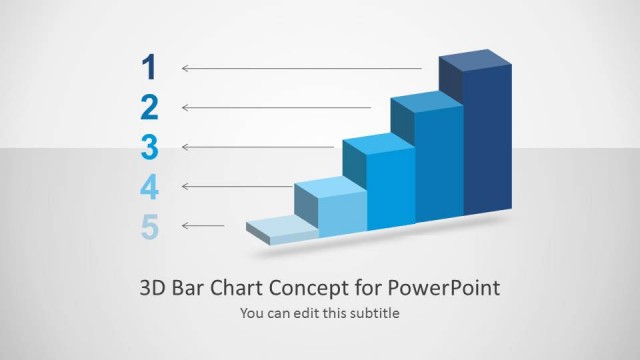
This downward trending bar graph features 3D cylinder shapes that are editable to demonstrate a vertical bar graph or another use-case.
What’s on This Slide
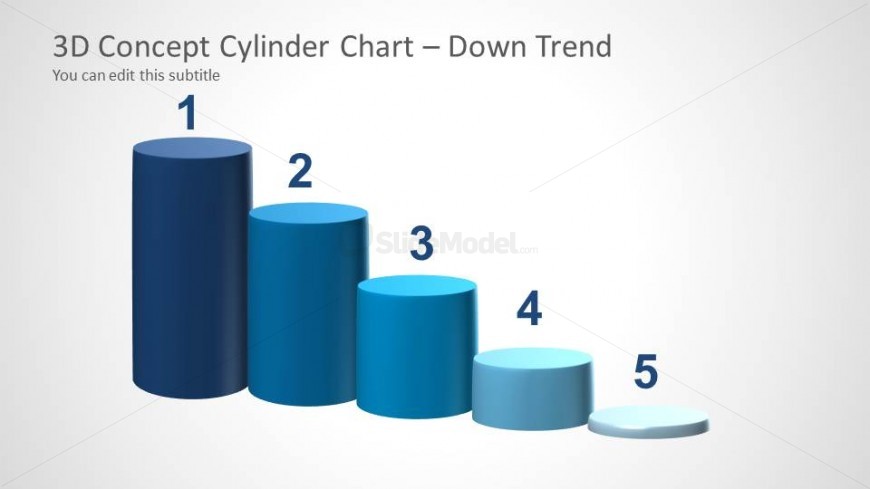
The layout features five 3D cylinder shapes arranged in a descending order from left to right. The first cylinder is the tallest and dark blue, while the subsequent cylinders decrease in height and shift to lighter shades of blue. Each cylinder is labeled with a number from one to five, positioned to the right of each shape. A title is placed at the top center, with a subtitle directly below it. The background is a light gradient, enhancing the visual contrast of the cylinders. There are no additional images or media placeholders present.
How to Use It
This layout serves as a visual representation of a downward trend, effectively illustrating data comparisons. It fits well in presentations discussing performance metrics, sales declines, or other negative trends. The structure allows for easy interpretation of data over time or categories. This slide is particularly useful in business contexts where clear visual communication of decreasing values is essential. It can be used in reports, meetings, or strategic planning sessions to convey important insights succinctly.
Text Placeholders & Capacity
Keep your copy within these limits so it fits without resizing. Node labels are single characters, allowing for concise identification.
| Placeholder | Count | Max characters (approx.) |
|---|---|---|
| Slide title | 1 | 30 |
| Subtitle | 1 | 30 |
| Item heading | 5 | 1 |