Slide 5 of 6 from 3D BCG Matrix for PowerPoint
BCG Matrix Slide Design for PowerPoint with Black Background
3D BCG Matrix for Portfolio Analysis
- Diagram
- Matrix Quadrant
- Strategic Analysis Slide
- 16:9
- 100% Editable
What’s on This Slide
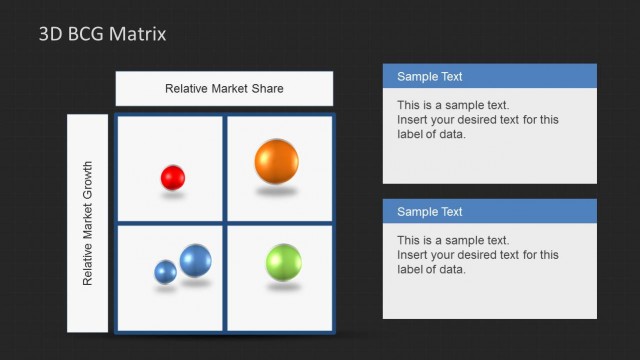
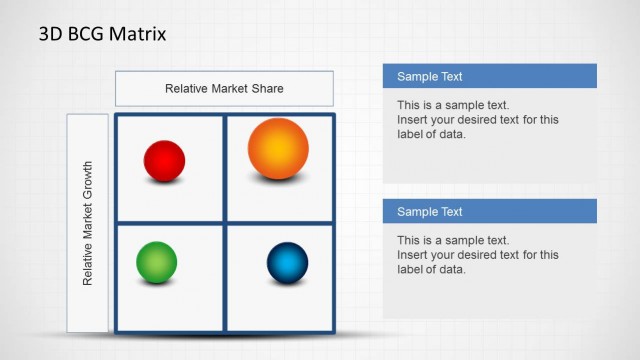
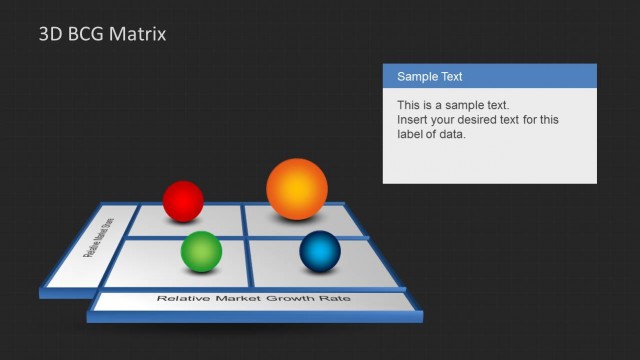
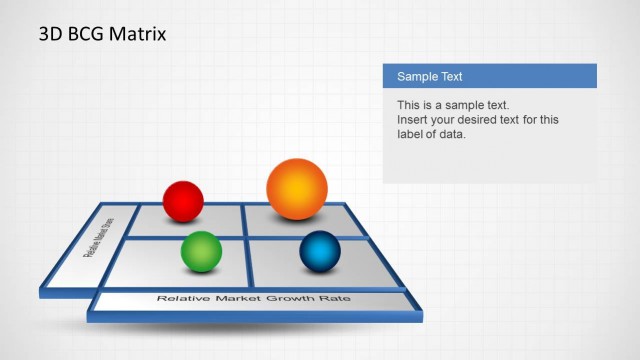
The layout features a 3D BCG matrix with four quadrants. Each quadrant contains circular shapes in various colors, representing different market categories. The top two quadrants are labeled with 'Relative Market Share' and the bottom two with 'Relative Market Growth Rate.' A star and a question mark are present in the upper right quadrant. The lower left quadrant includes a cow and dog icon. Text placeholders exist for the title and axis labels, positioned at the top and along the sides, respectively. The background is dark with a grid pattern.
How to Use It
This layout serves as a visual representation of the BCG matrix, useful for portfolio analysis in business presentations. It fits well after problem identification slides, helping to categorize products based on market share and growth rate. This structure is applicable in strategic planning, product management, and investment analysis, allowing stakeholders to visualize product positioning and make informed decisions. It can be used to highlight strengths, weaknesses, and opportunities in a portfolio context.
Text Placeholders & Capacity
Keep your copy within these limits so it fits without resizing. Title and axis labels have moderate space, roughly 15-20 characters each.
| Placeholder | Count | Max characters (approx.) |
|---|---|---|
| Slide title | 1 | 20 |
| Item heading | 4 | 15 |
| Axis label | 2 | 25 |
Slide Keywords
Download unlimited PowerPoint templates, charts and graphics for your presentations with our annual plan.
DOWNLOADReturn to 3D BCG Matrix for PowerPoint.