Slide 1 of 6 from 3D BCG Matrix for PowerPoint
6209-03-3d-bcg-matrix-1
3D BCG Matrix for Portfolio Analysis
- Diagram
- Matrix Quadrant
- Strategic Analysis Slide
- 16:9
- 100% Editable
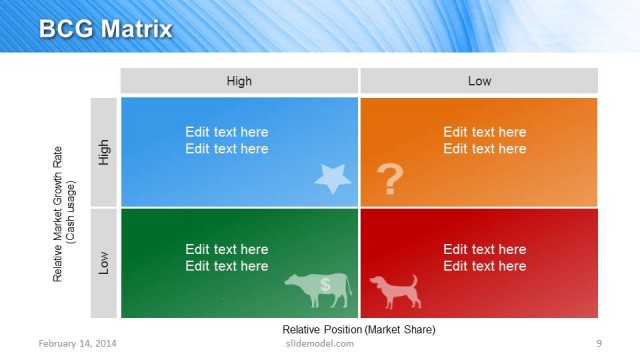
The 3D BCG Matrix slide layout from the 3D BCG Matrix for PowerPoint template offers a strategic analysis tool ideal for portfolio analysis and market positioning. This slide features editable shapes and vector icons arranged in a four-quadrant matrix, making it suitable for business presentations and corporate strategy discussions. Its design supports clear visualization of product strategy through a professional slide deck format compatible with PowerPoint templates and Google Slides templates.
What’s on This Slide
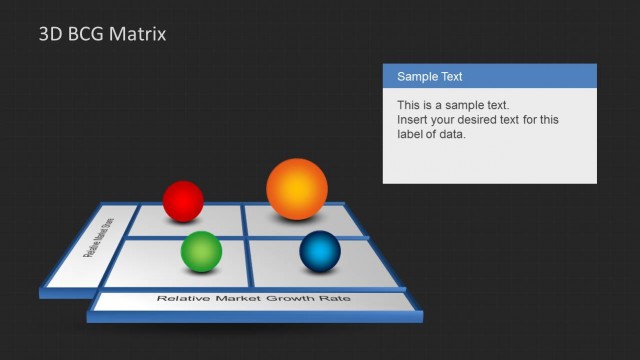
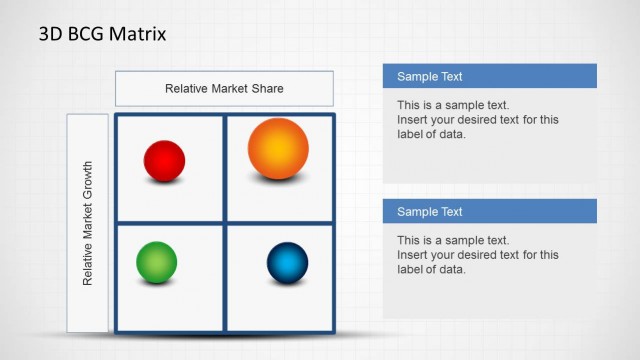
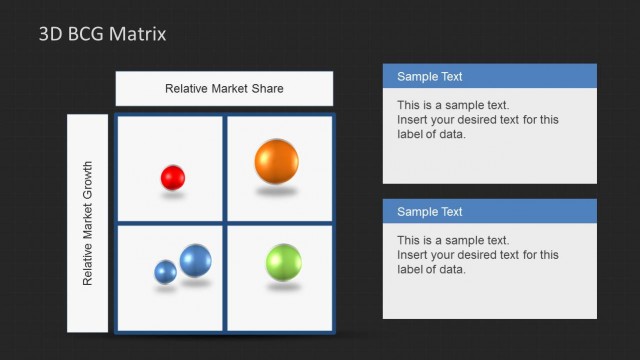
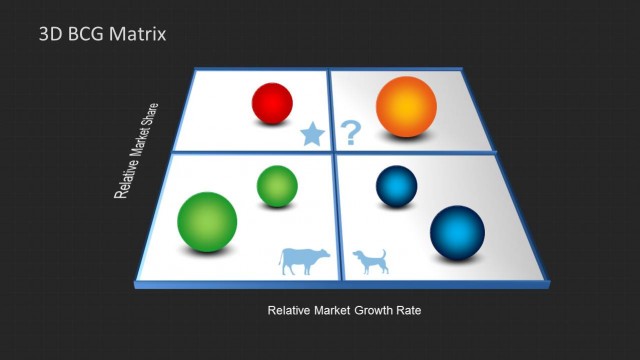
The layout features a 3D BCG matrix with four quadrants, labeled for relative market share and relative market growth rate. Three spheres of varying colors-red, green, and orange-are positioned within the quadrants, indicating different data points. A text placeholder is located in the top right corner, with a blue background, containing sample text for user input. The overall composition includes a grid background, enhancing the visual structure. The spheres vary in size and are placed strategically to represent different categories within the matrix.
How to Use It
This layout serves as a visual representation of the BCG matrix, commonly used for portfolio analysis in business strategy presentations. It fits well in a sequence discussing market positioning or product performance. This structure is useful for analyzing product lines or business units based on their market share and growth potential. It can be applied in corporate strategy meetings, product planning sessions, or executive reviews to facilitate decision-making.
Text Placeholders & Capacity
Keep your copy within these limits so it fits without resizing. Node labels can accommodate short phrases, roughly 3-5 words each.
| Placeholder | Count | Max characters (approx.) |
|---|---|---|
| Slide title | 1 | 20 |
| Item heading | 3 | 15 |
| Callout | 1 | 100 |
Slide Keywords
Download unlimited PowerPoint templates, charts and graphics for your presentations with our annual plan.
DOWNLOADReturn to 3D BCG Matrix for PowerPoint.