Slide 4 of 6 from 3D BCG Matrix for PowerPoint
6209-03-3d-bcg-matrix-4
3D BCG Matrix for Portfolio Analysis
- Diagram
- Matrix Quadrant
- Strategic Analysis Slide
- 16:9
- 100% Editable
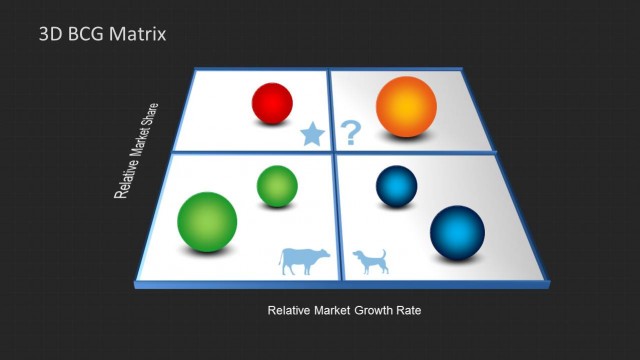
The 3D BCG Matrix slide from the 3D BCG Matrix for PowerPoint template provides a clear visual tool for strategic analysis in business presentations. This slide template features editable shapes and vector icons arranged in four quadrants to represent market share and growth rate, making it suitable for product portfolio analysis and growth strategy discussions. Its dark background enhances the visibility of the 3D elements, supporting effective communication in corporate presentation slide decks.
What’s on This Slide
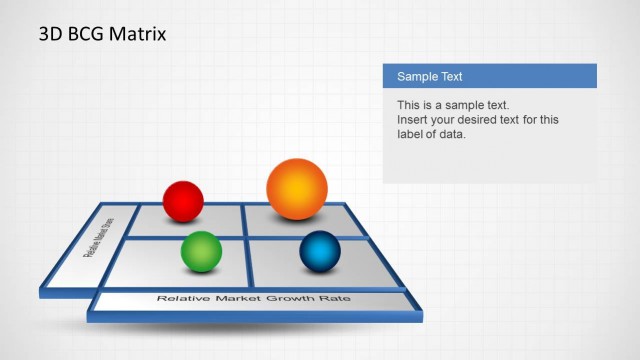
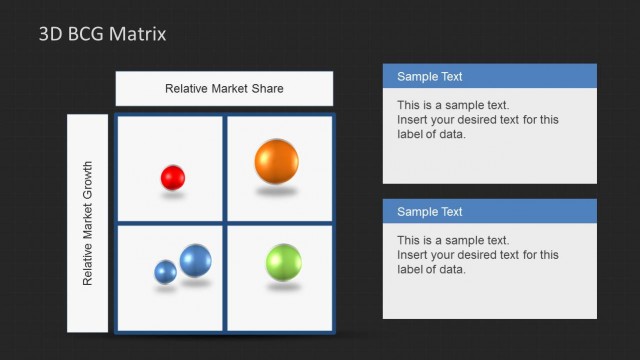
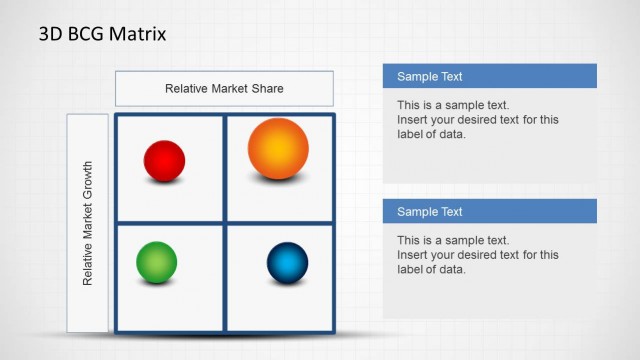
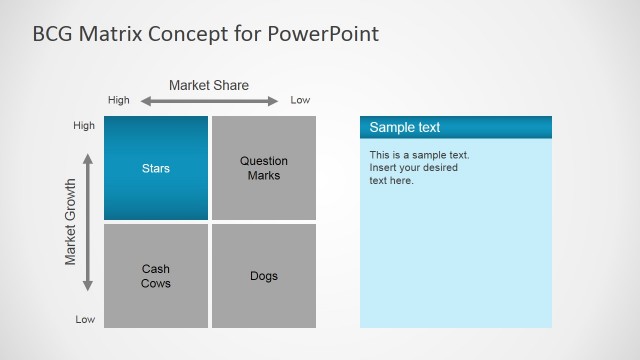
The layout features a 3D BCG matrix with four quadrants, labeled for relative market share and growth rate. Three spheres of varying colors and sizes are positioned within the quadrants, indicating different product categories. A text box on the right side contains sample text, aligned to the top and right, serving as a placeholder for data labels. The background is dark, enhancing the visibility of the matrix and spheres. The overall composition emphasizes the matrix structure, with clear visual hierarchy and spatial separation of elements.
How to Use It
This layout serves as a visual representation of the BCG matrix, ideal for analyzing product portfolios based on market share and growth rate. It fits within a presentation sequence focused on strategic analysis or product planning. Suitable scenarios include corporate strategy discussions, product lifecycle assessments, and executive reviews. The layout allows for easy insertion of data and insights, making it effective for conveying complex information in a structured format.
Text Placeholders & Capacity
Keep your copy within these limits so it fits without resizing. Text slots are moderate, with room for concise data entries.
| Placeholder | Count | Max characters (approx.) |
|---|---|---|
| Slide title | 1 | 20 |
| Item heading | 4 | 15 |
| Body paragraph | 1 | 100 |
Slide Keywords
Download unlimited PowerPoint templates, charts and graphics for your presentations with our annual plan.
DOWNLOADReturn to 3D BCG Matrix for PowerPoint.