3D BCG Matrix Slide Design for PowerPoint
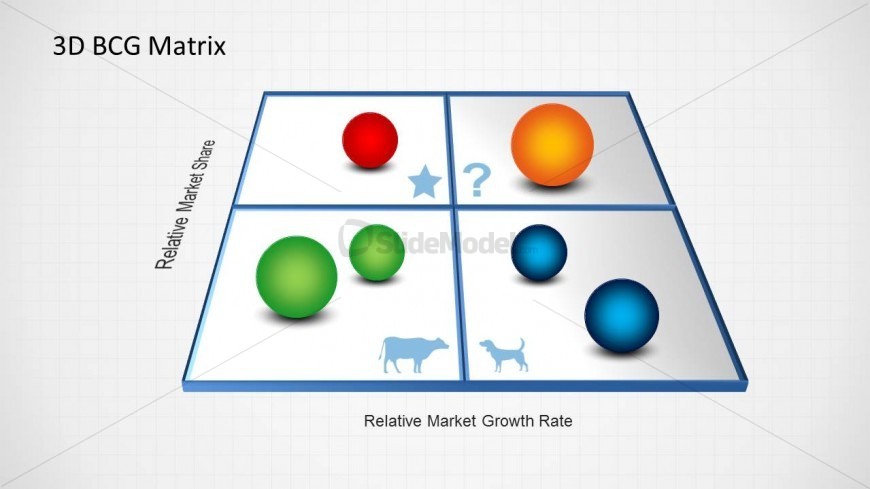
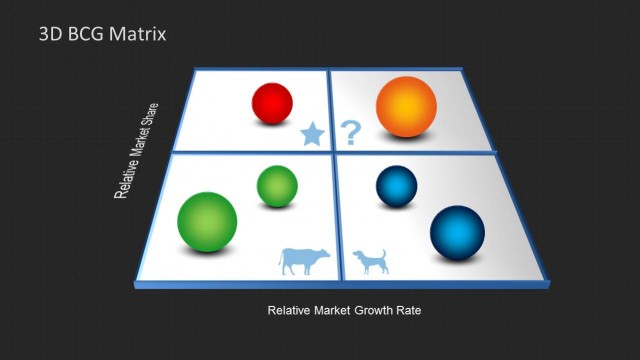
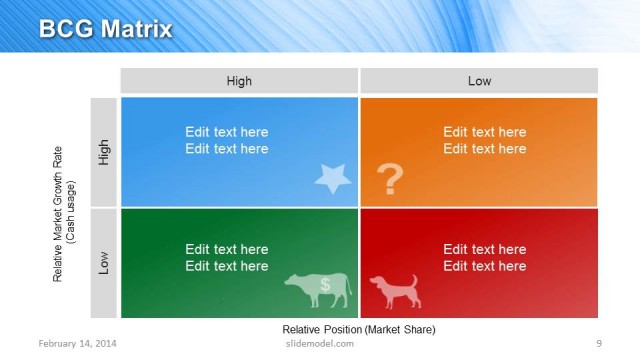
The PowerPoint template features a BCG growth-share matrix which is commonly used to analyze business units in order to properly allocate funding. The 3D BCG matrix template, originally created for the Boston Consulting Group, is a scatter graph divided into quarters. The x-axis of the matrix to be found on the slide design is labeled “Relative Market Growth Rate”, while the y-axis is labeled “Relative Market Share”, signifying that the different elements found in the PowerPoint graphic are arranged according to the relation of its relative market growth rather to its relative market share.
The four icons found in each quarter of the BCG matrix corresponds to the terms used to rank business units, namely, cash cows, dogs, question marks, and stars. The 3D spheres found in different areas of the matrix represent a product or service, and are colored according to the area of wherein they are found. The lone sphere in the quarter marked with a star is colored red. The orange sphere is found in the area representing question marks. The cash cow quarter contains two green sphere of varying sizes. The dog quarter also contains two, however, these spheres are blue. The PowerPoint objects are 100% editable to fit the presenter’s needs.
Return to 3D BCG Matrix for PowerPoint.