CATWOE Analysis: A Holistic Approach to Problem Solving
In this article, we explore what CATWOE Analysis is and how it can be used as a powerful problem-solving tool.
Team Charter: Ultimate Guide (with Examples)
As a team leader, it is necessary to establish a working roadmap with each team member’s different roles and responsibilities and the objective and purpose of the project. This article explores how a Team Charter can help you toward this goal.
Overview of 10 Proven Change Management Models
In this article, you will learn about the most popular and pre-proven models to manage change within any organization. Learn the basics and then the ppt templates that will help you through the process with your team.
How to Drive Curiosity, Suspense, and Surprise in your Presentations
We want to apply techniques that help us increase our audience’s engagement level. In this article we explain the Kinder Egg Effect to trigger Curiosity, Suspense and Surprise.
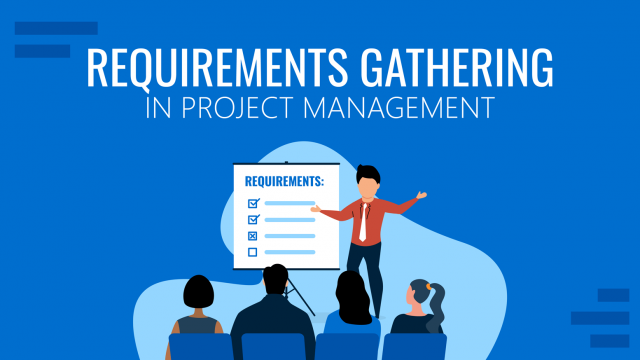
Requirements Gathering in Project Management: A Quick Guide
Establishing a Requirements Gathering is one of the fundamental steps to carry out a project successfully. In a requirements gathering document you can establish all the necessary requirements that the business solution must have. This document serves as a roadmap for each team member.
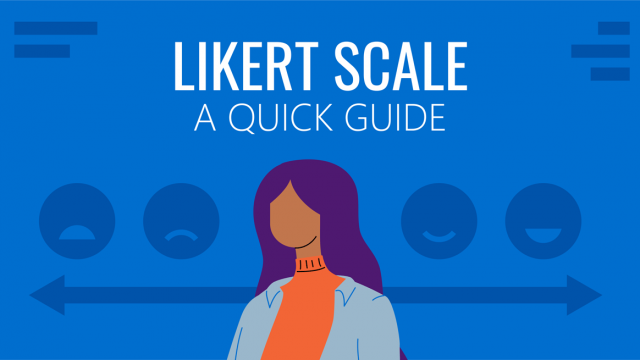
Likert Scale: A Quick Guide on Gauging your Customers’ Satisfaction
In this article, we present the Likert Scale. We also explore the different types of Likert scales and the advantages and disadvantages of using them in surveys and questionnaires.
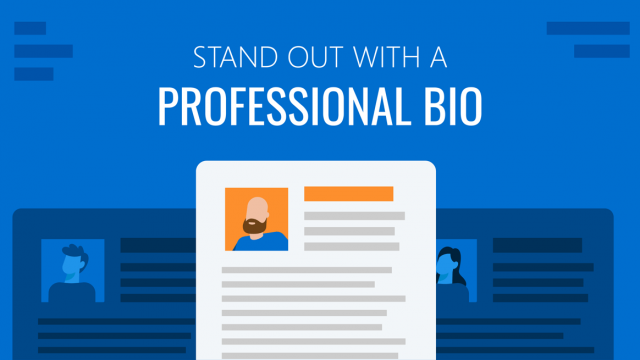
Stand Out With a Professional Bio: Tips, Bio Template (Examples Included)
Entrepreneurs and professionals need a solid description to attract potential employers, clients, and investors. A professional bio should demonstrate one’s strengths and motivations and portray them as experts in their field. In this article, we review how to make a professional bio.
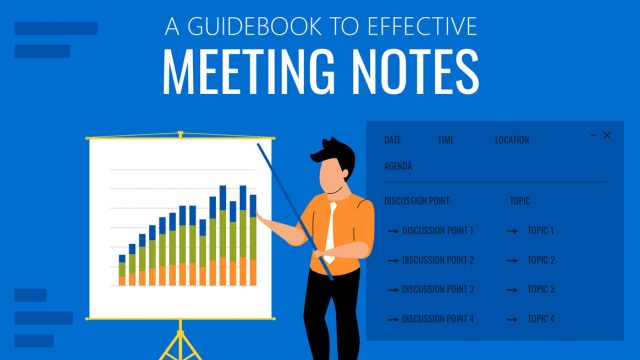
A guidebook to set Meeting Objectives by taking Effective Meeting Notes
Make an impact in your meetings by applying the science of note-taking. Capture all the valuable information you require by taking effective meeting notes.
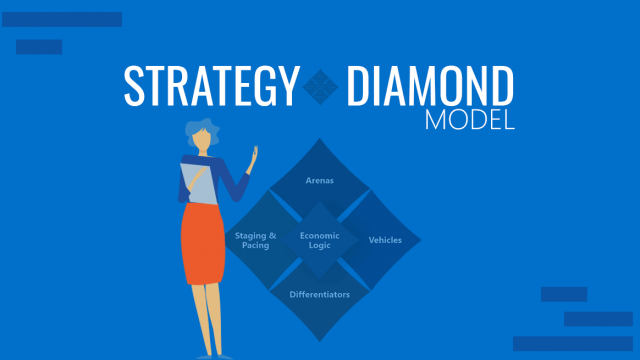
Strategy Diamond Model: A Tool to Make Critical Strategic Decisions
In this article, we explore the Strategy Diamond model, a tool that will help make critical strategic decisions.

Servant Leadership: Key Principles for Managers
Over the years, many different leadership theories tried to explain how someone wields power and rallies the people around them. In this article, we’ll review another type of leaders whose influence is gained via “software means”: the servant leader.

How To Create a Waterfall Chart in PowerPoint and Excel
What Is a Waterfall Chart? Waterfall Charts are a special representation of Stacked Bar Charts that resemble a waterfall due to its decreasing or increasing values moving from left to right. This kind of chart is usually used to describe cash flow fluctuations. The first bar describes the initial value of the flow (starting point). […]
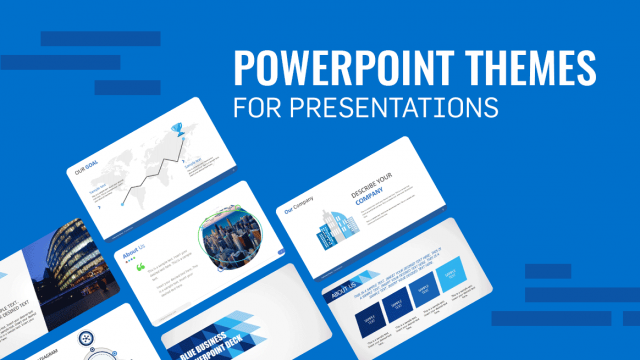
12 PowerPoint Themes 2024: Impactful Presentations That Stand Out
Collection of featured PowerPoint themes to make impactful presentations and engage your audience.