Clarity is the foundation of persuasive communication. In professional presentations, ideas often lose strength not because they lack substance, but because their internal logic remains invisible to the audience. The Opportunity Solution Tree (OST) addresses this challenge by revealing how objectives, insights, and actions connect. It allows presenters to visualize reasoning, not just results, turning abstract strategy into a structured narrative.
Initially designed for product teams, the OST has evolved into a versatile framework for any context where strategic decisions must be explained or justified. In boardrooms, classrooms, and client meetings alike, it helps speakers demonstrate the rationale behind their choices while maintaining focus on measurable outcomes. This capacity to transform complexity into coherent storytelling makes the OST particularly valuable in presentations that demand analytical depth and transparency.
Table of Contents
- Introducing the Opportunity Solution Tree
- Structuring Ideas for Clarity and Impact
- Using the OST in Different Presentation Contexts
- Complementary Diagrams and Models for OST Presentations
- Common Presentation Mistakes with OSTs
- FAQs
- Final Words
Introducing the Opportunity Solution Tree
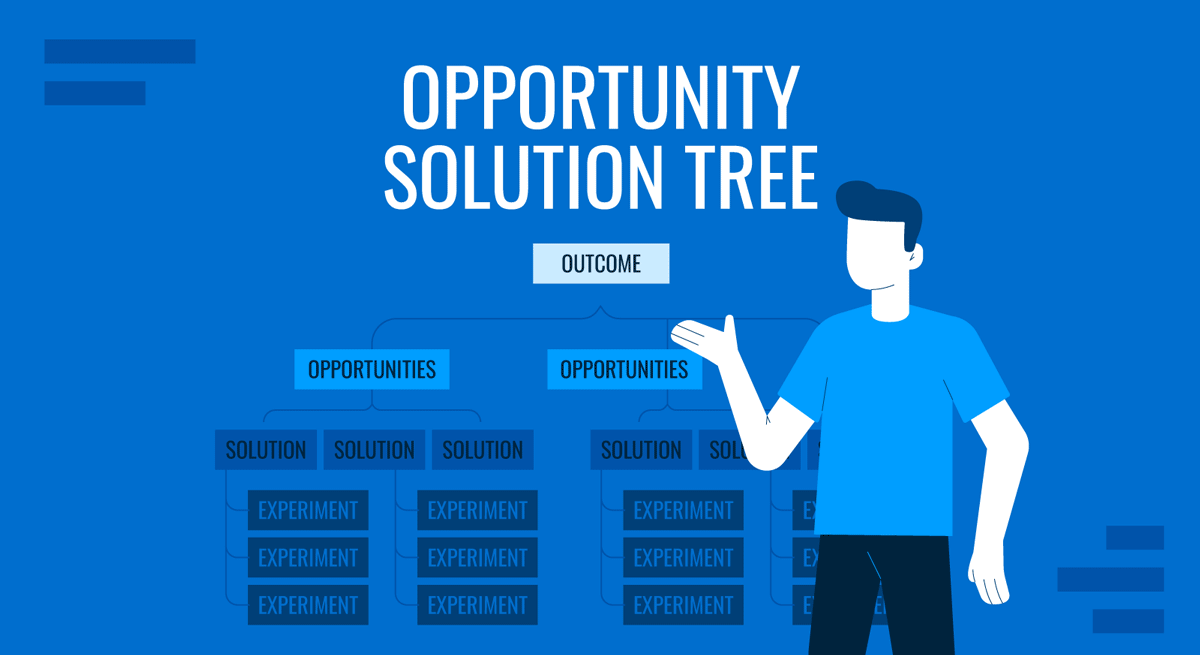
The OST traces its origins to product discovery frameworks, but its structure translates effectively across fields that require systematic reasoning, from corporate strategy and consulting to academic and policy presentations. It helps an audience see the logic, causality, and priorities in a single view. The diagram typically starts with a central Outcome at the top; the goal the team seeks to achieve. Below that, Opportunities represent user needs, market gaps, or data-driven insights. Each opportunity connects downward to Solutions, which are the potential initiatives or approaches to address those needs. At the base, Experiments describe the actions or tests that validate whether those solutions work.
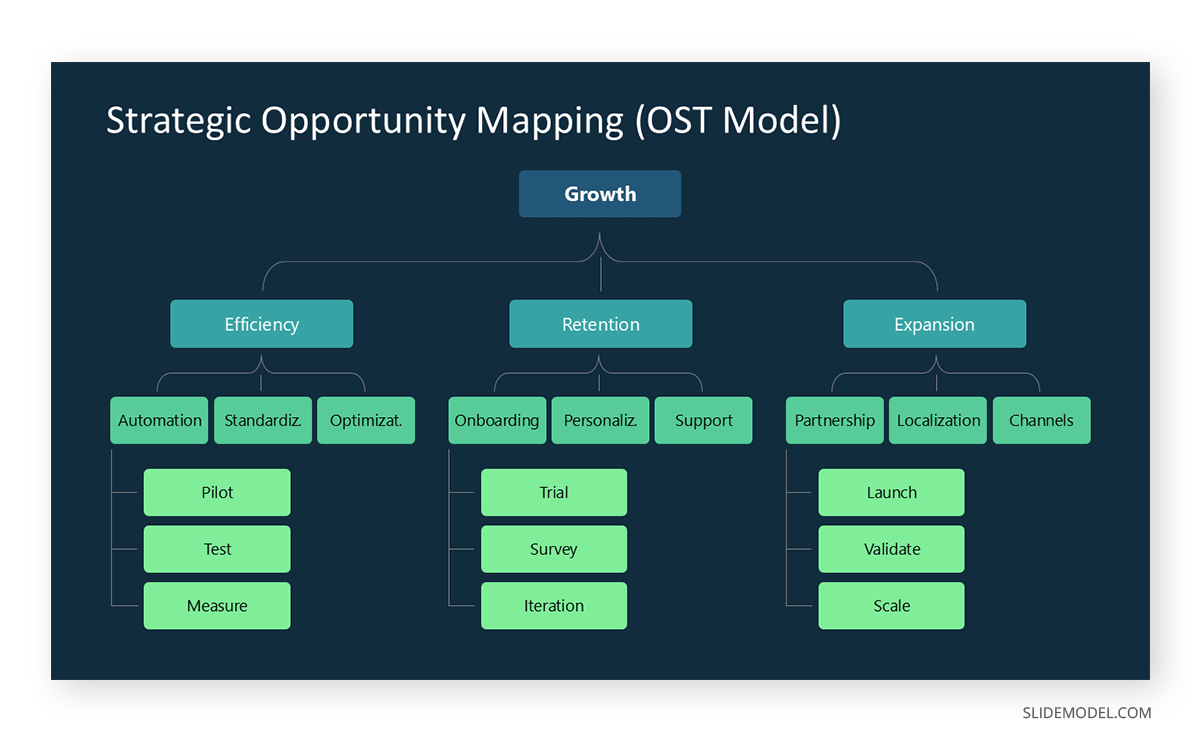
When used in a presentation, the OST becomes a visual narrative. It transforms a complex decision process into a sequence of relationships that are easy to follow. Instead of jumping between unrelated slides or presenting isolated facts, the presenter guides the audience through a structured reasoning path. Every branch answers an implicit question: Why this opportunity? Why this solution? How does it connect to the outcome?
Unlike a roadmap or timeline, which shows when things happen, the OST shows why they happen. It’s not chronological; it’s logical. This difference is crucial when explaining strategic direction, design reasoning, or decision-making frameworks. The OST enables you to communicate strategic coherence without oversimplifying reality.
An OST slide can condense hours of research and deliberation into a single view. Its power lies in visual economy: the audience sees the whole decision landscape at a glance. For presenters, this means fewer explanations and fewer misunderstandings. For audiences, it means context, structure, and rationale, all in one frame.
Structuring Ideas for Clarity and Impact
The greatest challenge in professional presentations is not a lack of information but a lack of structure. When the presenter cannot connect data, insight, and decision into a coherent thread, the audience struggles to follow. The Opportunity Solution Tree solves this by forcing a hierarchy of reasoning.
Every OST begins with a clearly defined Outcome, a measurable state of success. This top node acts as an anchor for the narrative. Without a defined outcome, even a well-designed presentation feels fragmented. As the presenter, you must articulate the goal in operational terms, not slogans. “Improve retention by 15%” communicates focus; “Enhance user engagement” does not.
Once the outcome is visible, you descend into Opportunities. These are not random ideas or feature requests but evidence-based insights. In a presentation, each opportunity must connect logically to the outcome. This reinforces analytical discipline: if you cannot draw a direct line between the two, the opportunity does not belong on the tree. Audiences respond well to this clarity because it demonstrates prioritization, a rare quality in strategy decks.
Below opportunities come Solutions. Here, the tree shows potential interventions. When presenting, the temptation is to dive deep into features or tactics. Resist it. Your task is to illustrate that you understand the reasoning chain, not to overload the slide with execution details. The OST provides a framework for restraint: show the options, highlight trade-offs, and explain selection logic.
Finally, Experiments form the practical base. They are where theory meets evidence. Including them in a presentation communicates that decisions are not final opinions but hypotheses to be tested. For leadership or client audiences, this is powerful; it frames the team as rigorous and adaptable.
Using the OST in Different Presentation Contexts
While the Opportunity Solution Tree was initially created for product discovery, its structure adapts well to many professional settings. Each context demands slight changes in focus, language, and level of detail.
Strategy Meetings
In strategic presentations, the OST helps align executives around shared reasoning. Here, the emphasis is on outcomes and opportunities. Avoid detailed descriptions of experiments; focus on demonstrating how opportunities align with corporate goals. Executives need to understand direction, not procedure.
Project Reviews
For internal project updates, balance all four layers. Stakeholders appreciate seeing not just results but the thinking behind next steps. Use the OST to show how current work connects to validated opportunities, preventing the perception of arbitrary decisions.
Consulting or Client Presentations
When used in consultancy presentations, the OST acts as a transparency device. It shows that your recommendations are grounded in evidence rather than intuition. Emphasize how the chosen opportunities reflect the client’s context. Avoid technical language; instead, show the logical flow, from outcome to insight to proposal.
Education and Research
In academic or training presentations, the OST can visualize reasoning pathways. For example, an instructor explaining alternative approaches to a problem can map them on a tree. This helps learners understand how different hypotheses relate to a single objective.
Cross-functional Teams
In multidisciplinary settings, differences in terminology can lead to misunderstandings. The OST neutralizes this by providing a shared visual vocabulary for everyone. You can label branches with plain language that all departments understand, reducing friction during collaboration.
In every context, adapt the level of granularity. Senior audiences prefer synthesis; operational teams prefer detail. Always tailor your OST to the meeting’s purpose. A slide built for exploration looks different from one built for decision approval.
Complementary Diagrams and Models for OST Presentations
While the Opportunity Solution Tree provides the core structure for reasoning, it often benefits from additional diagrams that enrich context or clarify data relationships. These complementary visuals help audiences transition from abstract logic to tangible understanding, without overloading the main OST slide.
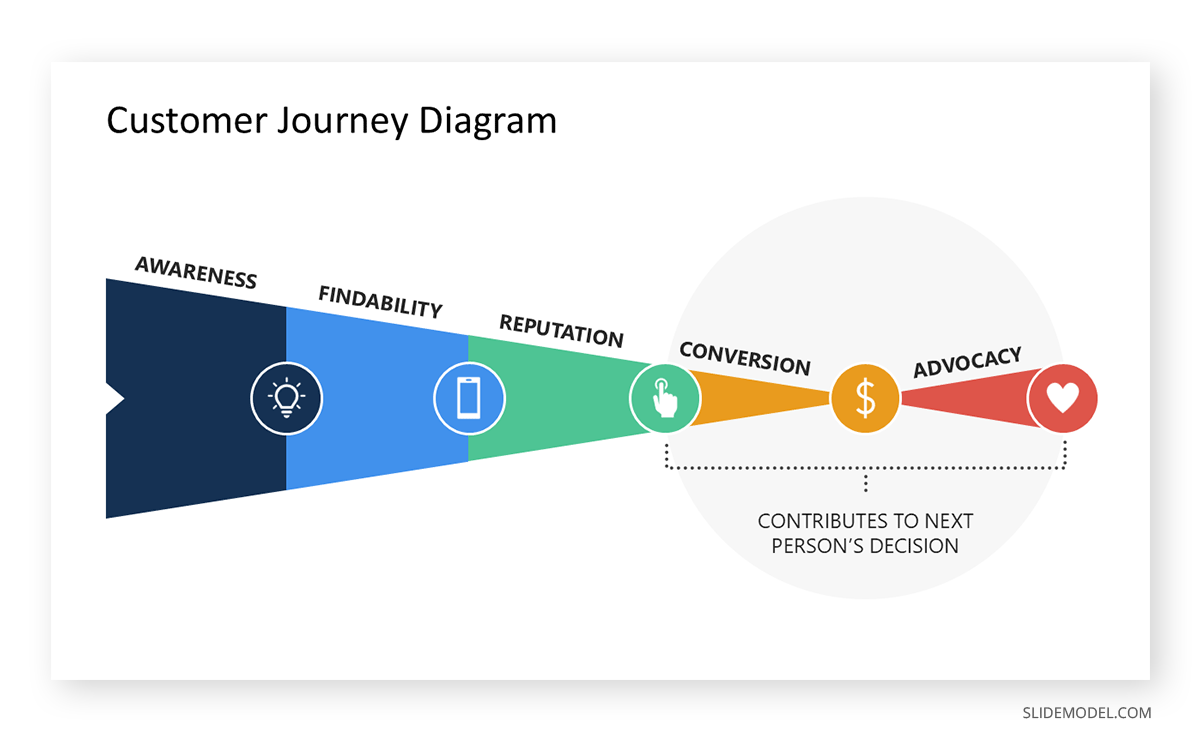
Journey Maps
Journey maps illustrate user or process flow across stages. They pair well with the OST’s opportunity layer, revealing where problems emerge and how they connect to specific outcomes. In presentations, using a journey map before displaying the OST helps audiences understand the human or operational landscape that gave rise to the identified opportunities.
Problem-Solution Matrix
The problem-solution matrix model plots challenges against potential interventions, serving as a bridge between the opportunity and solution layers of the OST. It enables the presenter to compare alternative strategies or demonstrate prioritization before settling on the tree’s final structure. When integrated, it highlights why certain branches of the OST were chosen over others.
Impact-Effort Diagram
Used to evaluate feasibility, the impact-effort matrix complements the experiment layer of the OST. Presenters can use it to justify which tests or actions should proceed first, showing that decisions are grounded in resource efficiency rather than intuition. This visual works particularly well in strategy reviews and product planning sessions.
Cause-and-Effect (Fishbone) Diagram
When opportunities stem from systemic or multifactor problems, a cause-and-effect diagram can precede the OST. It clarifies underlying drivers before the audience sees proposed solutions. This approach ensures that the OST does not appear speculative; it’s anchored in diagnostic evidence.
Roadmaps and Timelines
Though the OST focuses on why, audiences also want to know when. A roadmap or timeline can follow the OST to translate logical sequences into temporal plans. This connection reassures stakeholders that strategic reasoning aligns with realistic scheduling.
KPI or Metric Dashboards
For outcome-driven discussions, dashboard templates complement the OST by quantifying success indicators. When shown immediately after the tree, they reinforce that outcomes are measurable, not conceptual, and help maintain accountability for the proposed actions.
Feedback Loop Diagrams
In presentations centered on continuous improvement, feedback loops visualize how experiments lead to new opportunities: effectively turning the OST into an iterative system. They illustrate the cyclical nature of testing, learning, and refining strategies.
Common Presentation Mistakes with OSTs
Even a strong framework can fail if poorly executed. Many presenters misunderstand what the OST represents and reduce it to a decorative diagram. The following errors are common and easily avoidable.
Treating the OST as a Mind Map
A mind map explores ideas without hierarchy. The OST is the opposite; it enforces hierarchy. Mixing the two confuses the audience. Keep the tree directional: the outcome leads to the opportunity, not the other way around.
Overloading with Text
The OST should summarize logic, not replicate documentation. If each node contains complete sentences, the audience stops listening and starts reading. Use concise labels that you can expand verbally.
Weak Outcome Definition
An unclear or generic outcome makes every subsequent layer meaningless. “Improve satisfaction” or “Optimize process” sound polished but explain nothing. Without specificity, the audience cannot judge relevance.
Disconnect Between Opportunity and Solution
Sometimes, presenters list opportunities and solutions with no clear link. This breaks the chain of logic and undermines credibility. Always verify that each solution addresses a single chance.
Visual Clutter
Crowded branches, inconsistent connectors, and multiple colors distract from the message. The OST should be a reasoning map, not an art project. Simplify aggressively.
Ignoring Flow During Delivery
Revealing all branches at once can overwhelm. Sequence your explanation. Guide the audience from top to bottom in rhythm with your speech. Let pauses act as transitions between reasoning levels.
Using the OST Without a Narrative Setup
Dropping an OST slide into a presentation without context leaves the audience wondering what it is. Introduce it by framing the question it answers: “Here’s how we connected our insights to actionable experiments.” This orients the audience immediately.
FAQs
What is the primary purpose of using an Opportunity Solution Tree in a presentation?
To make reasoning visible. It allows audiences to see how objectives, opportunities, and actions connect logically.
Can I use an OST even if I don’t have quantitative data?
Yes. The OST maps logic, not metrics. Qualitative insights, observations, feedback, and interviews can effectively populate the opportunity layer.
How detailed should the tree be?
Limit each layer to a level of detail your audience can process in 30 seconds of viewing. For most decks, four to six branches per layer is sufficient.
Should every opportunity lead to multiple solutions?
Not necessarily. A single, well-defined solution may be enough if it addresses the opportunity entirely. The point is clarity of reasoning, not symmetry.
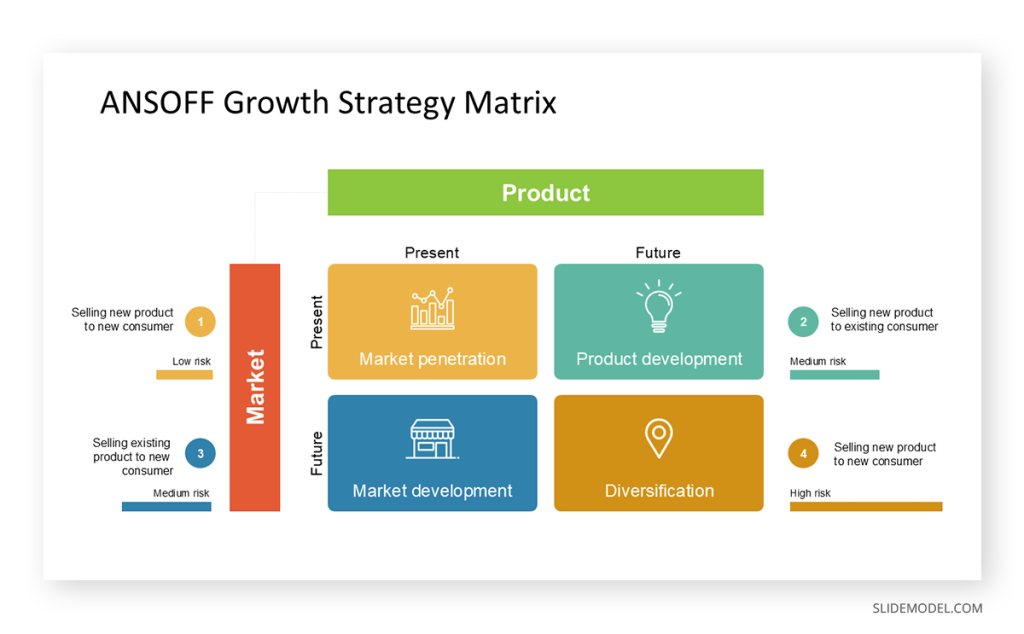
Can the OST replace a roadmap or strategy matrix?
No. The OST explains reasoning; a roadmap explains timing. They complement each other.
What software is best for creating OST slides?
PowerPoint or Google Slides with SmartArt, tree diagrams, or custom vector shapes are sufficient. For precision, use design tools like Figma or Illustrator, then import the visuals.
How often should I update the OST?
After every significant learning or decision pivot; the OST is a living document, not a one-time diagram.
Final Words
The Opportunity Solution Tree transforms abstract reasoning into structured visibility. In presentations, this clarity is invaluable. It helps audiences understand how decisions emerge from evidence rather than assumptions. By mapping thinking in a transparent hierarchy, presenters demonstrate strategic maturity and intellectual honesty.
An OST is not a decorative slide. It’s a visual reasoning tool, a way to narrate choices, trade-offs, and learning loops. When used well, it can replace lengthy explanations with a single glance of understanding.