Making and presenting social media reports is an important task in social media marketing. Following management best practices, monitoring and control is a crucial task. In order to monitor the social media efforts, plans are created and KPI´s defined based on the original objectives. Social Media Reports help visualize the current state of KPI´s and the interpretation of them.
Every marketer should analyze your social media metrics on a consistent basis and create the respective reports that will accurately communicate key findings and action plans.
What Are Social Media Reports?
Social media reports are the documentation you create summarizes the analysis of the current state of the KPI’s defined for your social media plan and explains the conclusions arrived at. The most basic components of social media reports are the current performance metrics values, and their level of achievement versus the defined objective. These metrics are presented by different dimensions as demographics and time.
More comprehensive reports will place this data in context of the social media marketing strategy, in order to determine the effectiveness of the plan and progress towards reaching objectives. They’ll include insights into what to replicate, change, and start doing in the future.

Which is the Audience of Social Media Reports
Community managers and social media managers are the most likely to be creating social media reports. However, there are a lot of other positions within an organization that need to know the status of the social media performance.
Focus the reports on the important indicators your audience is interested in. For example, high level executives will be more interested in acquiring new leads and brand reputation, while Operative roles will be more interested in followers, and content performance. The higher the level in the organization, the more focused on the strategy. The lower the level in the organization, the more detailed the information should be.
How Often Do You Collect Social Media Metrics and Present Reports?
Depending on the level of visibility that your audience requires to have or defined in your social media marketing strategy, you’ll create weekly, monthly, and/or quarter social media reports.
You can decide how often to make and present social media reports by evaluating how often you and your team can realistically make changes to the social media plan.
For example, if you create month-long content plans, then it probably doesn’t make sense to make weekly social media reports.
However, if you operate more on a week-by-week or even a day-by-day model, then weekly social media reports make sense in order for you or your team to make more informed decisions. Most social media marketing professionals will also prepare monthly reports with broader social media marketing strategy implications.
Quarterly reports are most effective in institutions that operate with quarterly goals and strategies. You can also use these long-term reports to analyze trends over time.
The Most Important Metrics and Insights for Social Media Reports
Followers
This is the first and most basic metric people want to know about each social media platform. One thing to note, however, when you’re presenting this metric is that follower count isn’t always the most indicative of success. There are other social media metrics, such as engagement rate and click through rate, that many marketing specialists believe are more important than follower count – but you might want to use tools like Instagram follower tracker to get the most authentic results for further analysis.
Audience Demographics
There are two reasons to look into your audience demographics. One is to make sure you are reaching your target audience and adjust content and audience targeting if off. The other reason is to know who you are engaging and make sure your content is most appropriate for those populations.

Impressions & Reach
These metrics often get confused and even interchanged. While they have similar scopes, they’re not quite the same. Impressions are the number of times your content is displayed, no matter if it was clicked or not. Reach is the total number of people who see your content.
One thing to note with these two social media metrics is that they are quantity-dependent. This means, the more content you post, the more impressions you’ll get. So be careful with this metric. If you want to be able to compare weeks or months of content, regardless of post count, you can also track average impressions per post.
Engagement Rate
Engagement rate is the number of engagements (likes, comments, shares, etc.) divided by impressions or reach. As opposed to impressions and reach, engagement rate does not necessarily rise if you post more frequently. Rather, it depends purely on the quality of each piece of content posted.

Clicks & Click Through Rate (CTR)
Clicks and click through rate are metrics that clients and bosses always want to hear about since they figure directly into the sales funnel or conversion journey. For many, the ultimate goal is to get people to click on the link, whether that directs to a website, chat function, or purchase button.
CTR is the ratio of people who click on a link to the total number of people who view the content that contains that link. Click through rate isn’t a metric that you can easily find on all platform analytics. In fact, one of the only platforms that readily reports this for you is LinkedIn. For other platforms you’ll have to calculate it yourself.

Where Can You Find Social Media Metrics?
All platforms provide some level of metrics. Twitter Analytics. Facebook Insights. LinkedIn Analytics. Pinterest Analytics. Instagram Insights. YouTube Analytics.
Additionally, there are plenty of social media report tools and platforms that will show you additional information, such as Metricool, Kontentino, Sotrender, Sprout Social, HubSpot, Hootsuite, Buffer, etc. A compelling social media report tool is essential to keep track of your campaign results and useful to generate reports for your social media presentations.
Social Media Report Visual Aids: Graphs, Charts, and Tables
In order to make social media reports more interesting, professionals will use graphs and tables whenever possible to show data, trends, and statistics. When done right, your data can communicate and tell stories of their own. Here are some of the common options.
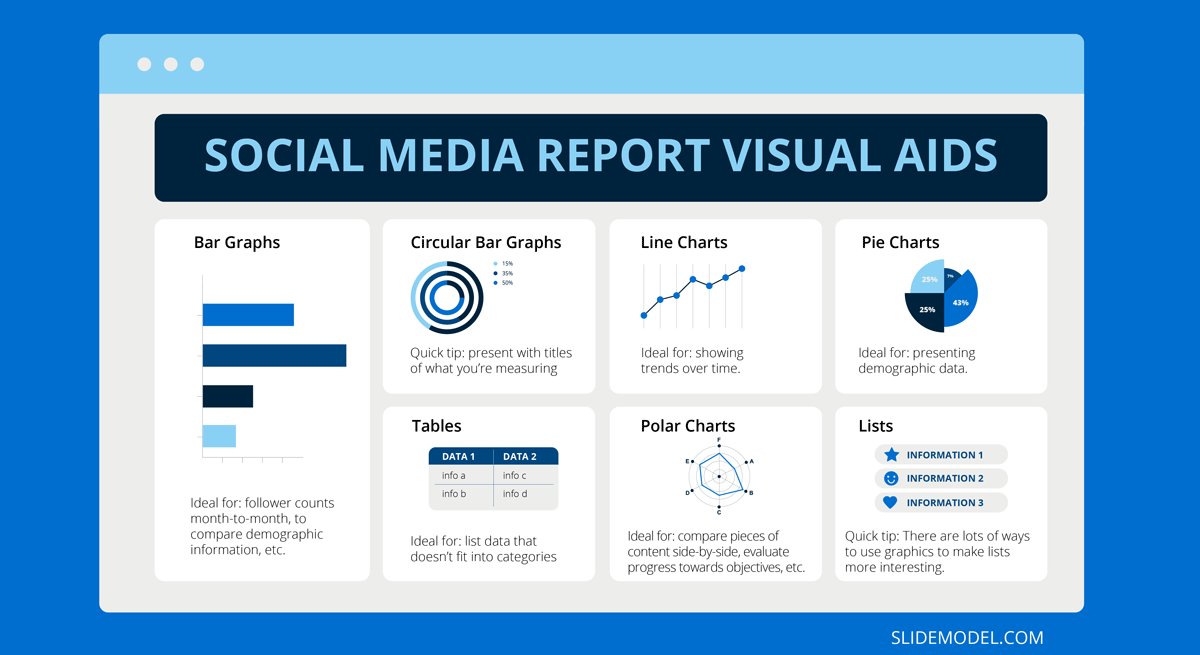
Using Bar Graphs in Social Media Reports & Presentations
Bar graphs are one of the most convenient visual aids for social media reports and social media presentations. Use them to present follower counts month-to-month, to compare demographic information, such age ranges of your followers, or to compare performance of different pieces of content in social media presentations.
Circular Bar Graphs
Circular bar graphs can be very visually engaging, though not quite as easy to read, which is why we recommend presenting circular bar graphs with titles of whatever you’re measuring.
Line Charts
Line graphs are ideal for showing trends over time. The difference between trends shown on line graphs versus bar graphs is that with line graphs, you can easily compare multiple factors over time. Bar graphs are most effective with shorter time periods.
Pie Charts
Pie charts show the proportions that make up a whole. That makes them ideal for presenting demographic data. Divide your audience by age, gender, education level, relationship status, etc.
Tables
There are a lot of possibilities of how to incorporate tables into your social media report. You can list data that doesn’t fit into categories and is therefore not a good match for bar and line charts, such as audience location or occupation. You can also use tables to present all pieces of content that were published during a period of time alongside other data of interest, such as content subject, publishing date and time, and content format.
Polar Charts
Polar charts are an interesting graphic that lets you compare different variables side-by-side in a circular presentation. Each variable is measured from the center of the circle outwards. Use polar charts to compare pieces of content side-by-side, evaluate progress towards objectives, or compare performance of different social media platforms. There are a lot of options for this one! Plus, it isn’t nearly as common as the previous visual aids, so the novelty alone will help your report engage its audience.
Lists
You might be thinking, “Lists? How are those visual aids?” It’s true that the last item on our list of visual components isn’t nearly as “visual” as the others. However, lists have always been an important part of social media reports. Just because you have the option to make a simple bulleted list doesn’t mean you have to. There are lots of ways to use graphics to make lists much more interesting.
Ways to Present Social Media Reports
There are three main ways to present social media reports and presentations: via email, in-person, and in online meeting. In any case, using Social Media templates for PowerPoint & Google Slides can help save hours of manual work. If you want to save more time creating social media presentations, you can also try SlideModel’s AI Presentation Maker to make your Social Media reports & presentations.
1. Offline Social Media Reports
Simply turning in your social media reports to clients and bosses may sound a lot easier than monthly presentations. However, consider these two aspects. If you don’t present social media reports in-person or at least virtually, you have no opportunity to give context, explain things, or answer questions. This means you’ll have to make your social media report document so thorough that whoever it reaches can understand it based on the report alone, which will require a lot more content, slides, and lines of text.
2. Presenting Social Media Reports In-Person
For in-person social media presentations, your presentation, body language, and voice are all key factors to doing a good job. Regardless of your subject matter, public speaking has its own list of do’s and don’ts, which you can read about here.
3. Online Social Media Report Presentations
As most people have realized, online presentations are their own challenges. More than ever, PPTs need to be interesting and engaging, yet not distracting, since you can’t rely so easily on public speaking hacks like eye contact and powerful body language. Here’s a guide to creating great online presentations. Also, read our article about how to create a report presentation.
Conclusion: When Done Right, Social Media Reports Give You an Action Plan
Comprehensive social media reports include enough information to make decisions about what to do next. Too often people create reports that end up being a waste of time for everyone involved, especially the person who went to all the trouble of compiling the data. This happens when people simply copy and paste statistics and data from social media platforms’ built-in analytics.
Instead, take the time to evaluate the context of each social media platform, analyze how the strategy was executed, and propose changes and improvements for the future. Don’t forget to present your data in an engaging way so that your audience really pays attention to your important insights. That way, you’ll be making and presenting social media reports that actually have an impact and lead to even better strategy than before.