Different types of data are often saved as Excel sheets. Whether it’s built directly in a spreadsheet, exported from a database, or pulled from a business intelligence dashboard, Excel remains one of the most common formats for organizing numbers and metrics. The challenge comes when that raw data needs to be transformed into something presentation-ready.
Converting Excel data into PowerPoint slides helps bridge that gap. This is because instead of recreating charts or manually rewriting figures, you can quickly turn structured data into clear, visual insights. This is especially useful when preparing slide decks for stakeholder presentations, client reports, quarterly business reviews, performance dashboards, or even classroom presentations. In this guide, we will explore different methods for converting Excel data into PowerPoint slides, from simple to automated processes you can use for your presentations. We will also explain how PowerPoint templates can help streamline the process by exporting Excel data to PowerPoint.
How to Convert Excel to PowerPoint
Method 1: Copy-Paste as Static Data for Tables and Charts
The most common and basic method for converting Excel data into PowerPoint slides is to use copy and paste. This method works best for static data, such as tables and charts, when you don’t need real-time updates or automation.
Step 1: Open your Excel file, select the data you want to transfer (either a table or a chart).
Step 2: Copy the data by pressing Ctrl/Command+C or right-clicking and selecting Copy after selecting it.
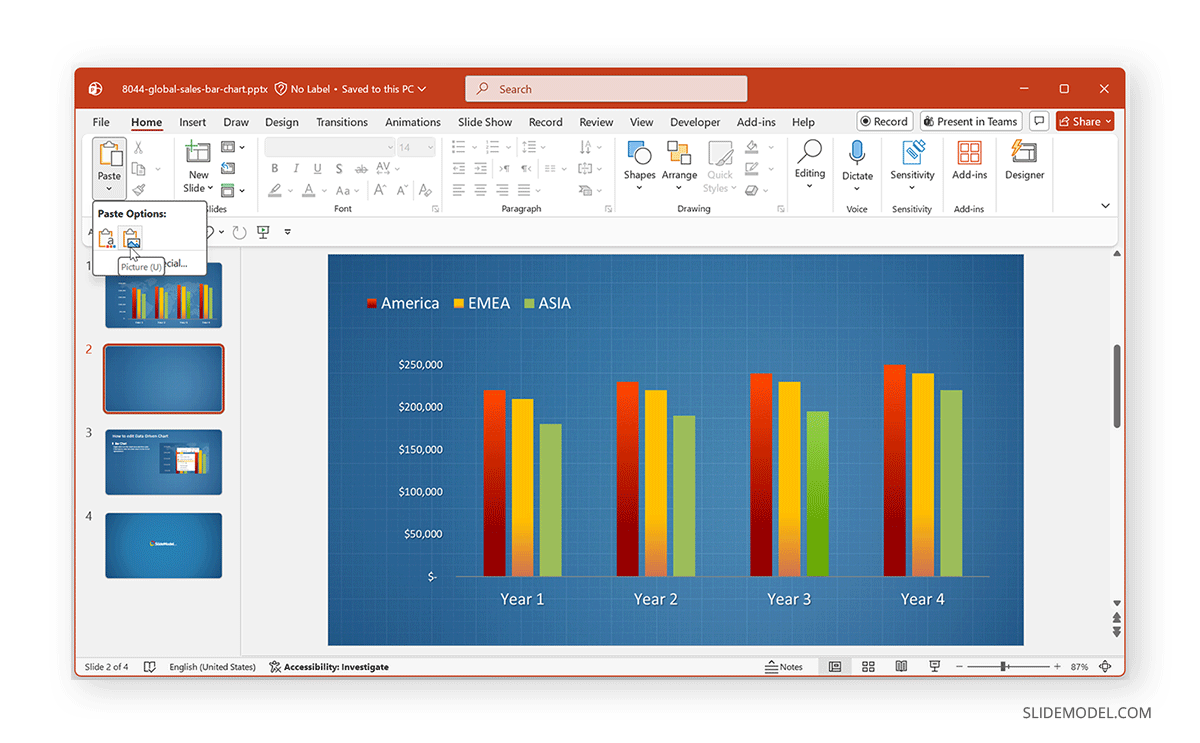
Step 3: Open your PowerPoint presentation, go to the slide where you want to place the data, then paste it using Ctrl/Command+V or by right-clicking and selecting Paste. When pasting data, you can also choose to paste Excel to PowerPoint without losing formatting by retaining source formatting.
Pros and Common Usage
- Quick Data Transfer: This method is useful for one-time presentations and quick data transfers. Since you can easily copy and paste data from Excel to PowerPoint.
- Useful for One-time Presentations: If your presentations don’t require frequent updates or you want to copy Excel data for a one-time presentation, this method can be useful.
Cons and Limitations
- Formatting Issues: You may experience formatting challenges when copying and pasting, particularly with large or complex datasets. For tables, you may need to adjust the formatting after pasting to ensure they fit within the slide. Similarly, for charts, you can paste them as images to ensure they look the same in PowerPoint.
No auto-update: The data remains static. If the original Excel data changes, you need to update it manually in the PowerPoint slide.
Method 2: Paste and Link Excel Data for Live Updating
If you need your PowerPoint slides to stay up to date with the latest Excel data, using the Paste Link method is your best bet. This method ensures that any changes made in Excel automatically reflect in your PowerPoint slides.
Step 1: In Excel, select and copy the data (a table or chart).
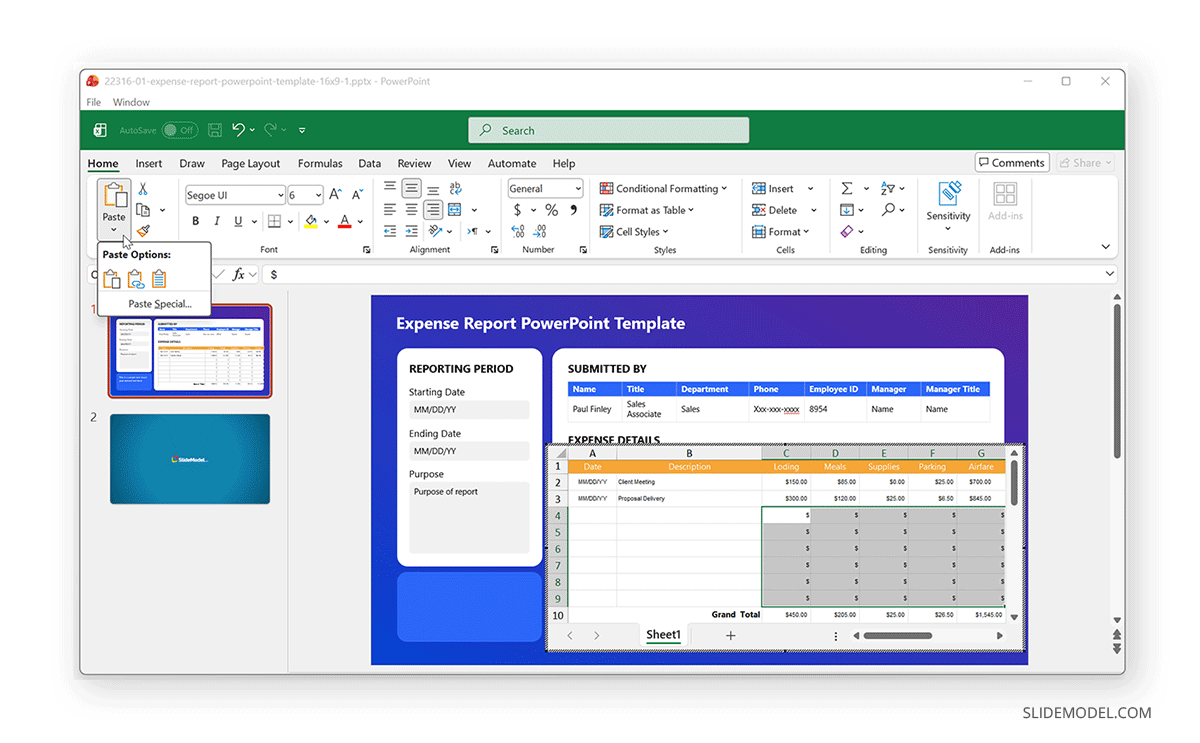
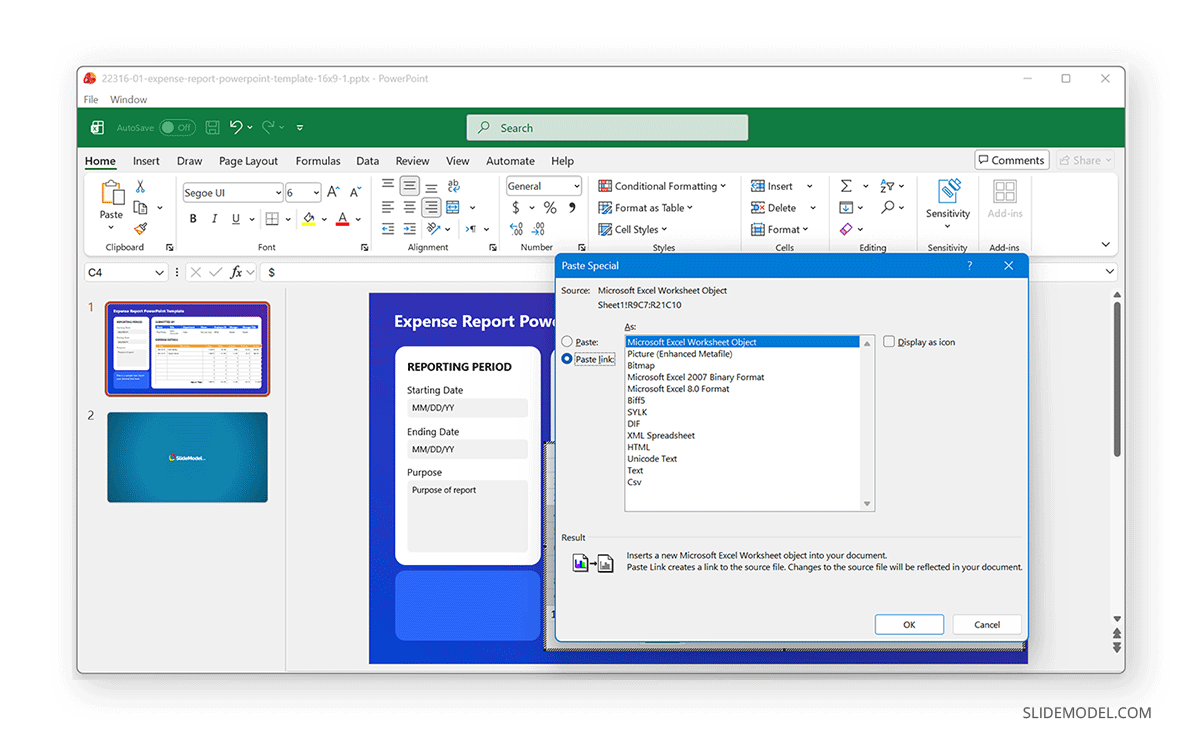
Step 2: In PowerPoint, navigate to the slide where you want the data, then use Paste Special to link the data via the right-click menu or the Home tab’s Paste dropdown, and select Paste Link.
Step 3: Choose the appropriate format (e.g., Microsoft Excel Worksheet Object for tables). The Excel data will be linked to your PowerPoint slide. When the Excel data is updated, the linked data in PowerPoint will update as well.
Pros and Usage
- Useful for Recurring Updates: This method is ideal for situations requiring regular updates to presentations, such as weekly reports, KPI tracking, or live dashboards. Since this method ensures data stays synchronized across Excel and PowerPoint. For more information, see our article on how to insert an Excel table into PowerPoint.
Cons and Limitations
- Accessibility of Files: The linked Excel file must remain accessible in its original location. This is because if the file is moved, renamed, or deleted, the PowerPoint link may break.
3. Export Excel Charts into PowerPoint
Charts are often the most effective way to present numerical data in PowerPoint. Exporting Excel charts to PowerPoint is relatively simple and helps you maintain high-quality visuals.
Step 1: In Excel, select the chart you want to use and right-click on the chart and click Copy.
Step 2: Open PowerPoint and select the slide where you want to place the chart. Paste the chart on the slide using Ctrl/Command+V or the Paste function via the Home tab. Optionally, you can paste the chart as a linked object to keep the data in sync with Excel or as an image.
The recommended chart types to export data from Excel include bar and column charts for comparisons, pie charts for proportions, and line charts for trends over time.
Pros and Usage
- Useful for Data Visualization: This method is best for presentations with visualized data and business reports. This is because it provides better visualization and integration with slides.
Cons and Limitations
- Chart Updates: This method may require manual updates to charts when data changes, especially if the chart is pasted as an image. Hence, this method is not suitable for frequent updates or for syncing recent data with your PowerPoint presentations.
4. Use PowerPoint Designer or SmartArt
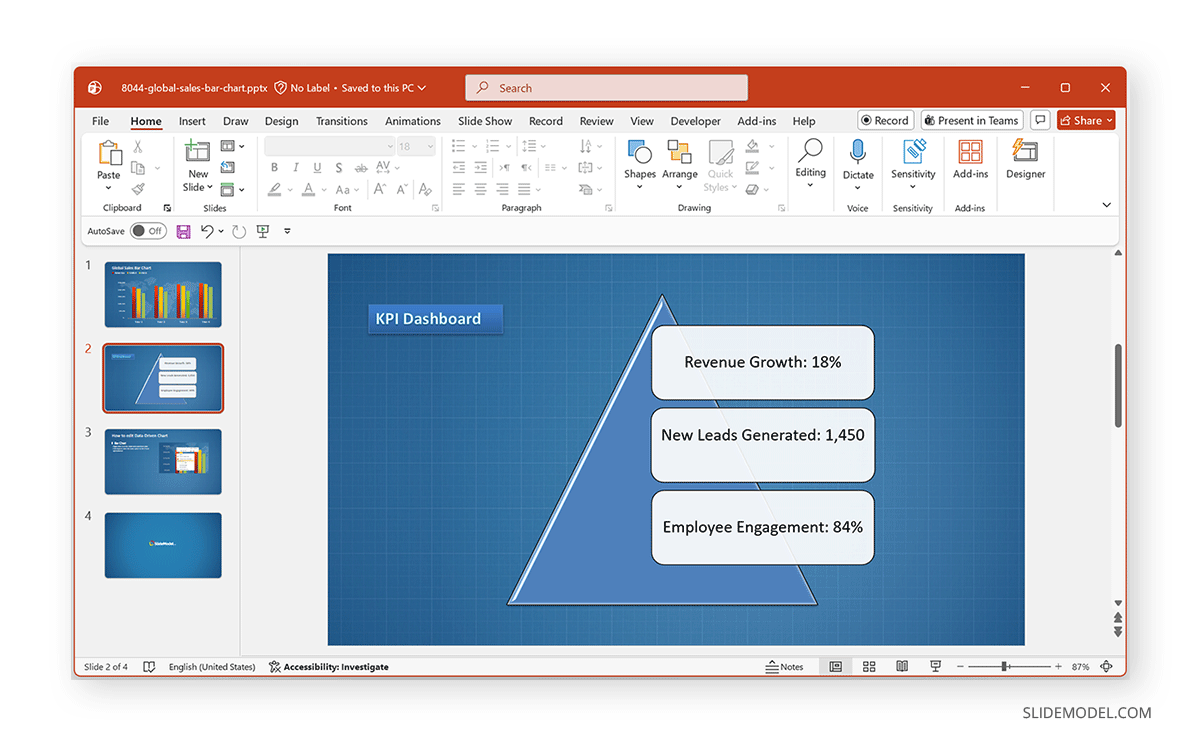
PowerPoint’s Designer and SmartArt features allow you to transform Excel data into visually engaging diagrams. If you have a structured list or hierarchy in Excel (such as a project timeline or a list of stages), these tools can help you convert that data into something more dynamic for your presentation.
Using Designer for Excel Data in PowerPoint
Step 1: Copy and paste the table or chart from Excel to PowerPoint.
Step 2: Go to Home -> Designer to access various design suggestions for creating your visuals. Select the design you deem suitable for your data.
Step 3: Format the newly added design to adjust the slide elements as needed.
Using SmartArt for Excel Data in PowerPoint
Step 1: Copy the list or data from Excel.
Step 2: In PowerPoint, navigate to the Insert tab and select SmartArt.
Step 3: Choose the appropriate diagram (e.g., process, hierarchy, or cycle).
Step 4: Paste your Excel data into the diagram and adjust the text boxes to fit the information.
Note: SmartArt converts pasted content into text-based diagram elements. Excel formatting and table structure will not be preserved.
Pros and Usage
- Easy-to-Analyze Visuals: This method is ideal for converting long lists or processes into easier-to-analyze visual formats.
- Suitable for Technical Diagrams: This method is great for showing processes, timelines, and hierarchies.
Cons and Limitations
- Manual Formatting: This method might require some manual formatting to fit data into the diagram. Both SmartArt and Designer features can require a lot of manual work to make your Excel data look standardized and easy to read in PowerPoint.
- Need to Recreate Visuals: If you frequently update visuals in PowerPoint, using this method would require recreating them each time.
5. Use Automation in PowerPoint and Excel with VBA / Macros
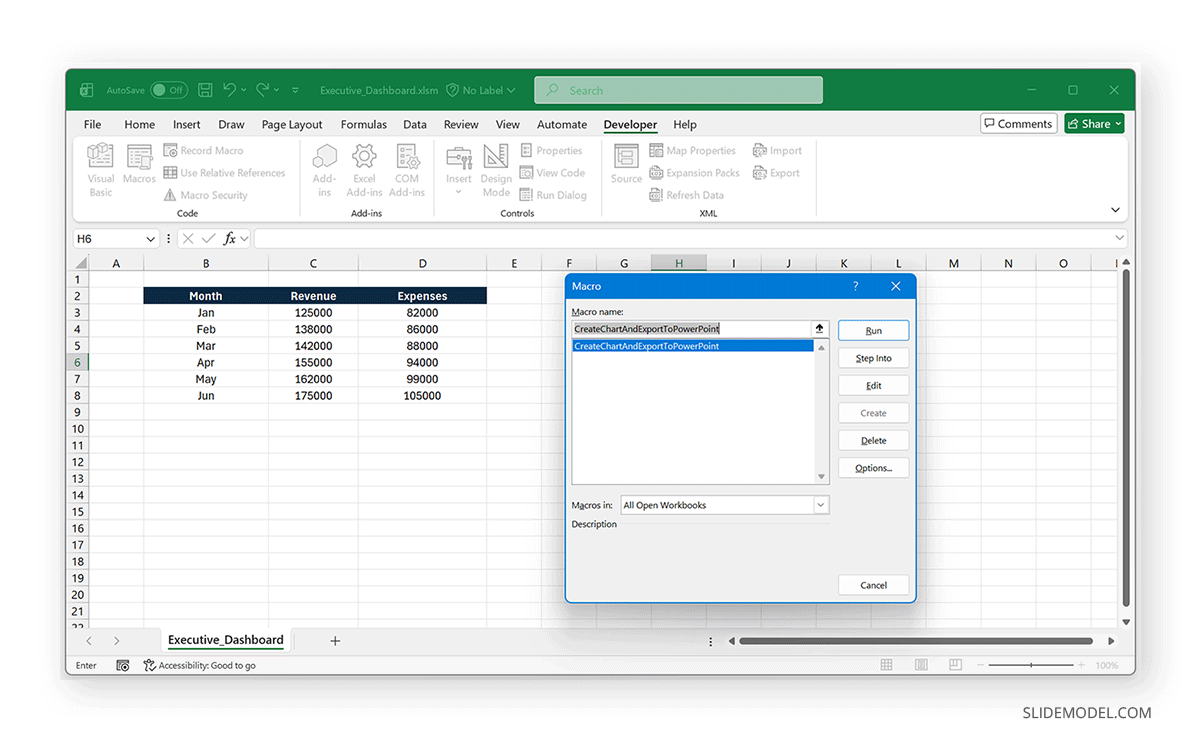
If you frequently need to generate PowerPoint presentations based on Excel data, using VBA (Visual Basic for Applications) / macros can automate the process. With VBA, you can write code that will automatically export charts, tables, and data from Excel into PowerPoint slides.
Step 1: Open Excel and navigate to the Developer tab (you may need to enable it in Excel options).
Step 2: Click on Visual Basic to open the VBA editor via Developer -> Visual Basic -> Insert -> Module.
Step 3: Write or copy-paste a macro that retrieves data from Excel and inserts it into PowerPoint.
Step 4: Save the Excel file as a macro-enabled Xlsm file.
Step 5: Run the macro in Excel. This will automatically generate PowerPoint slides with your Excel data.
Pros and Usage
- Recurring and Automated Reporting: This method can be used for recurring executive dashboards and automated reporting.
- Time Saving: This method saves time by automating repetitive tasks. It is perfect for businesses and analysts who need to generate consistent, automated reports with minimal effort. For more detailed instructions, see our PowerPoint VBA tutorial.
Cons and Limitations
- Familiarity with VBA: This method requires at least some experience with VBA.
- Requires Macro-enabled Files: Save your Excel file as a macro-enabled workbook (.xlsm). This can be an issue at times, as macro-enabled files can trigger security applications on systems, disrupting workflows.
6. Visualize Excel Data with PowerPoint Add-ins and Other Third-Party Tools
There are several PowerPoint add-ins and third-party tools that can streamline the process of converting Excel data into PowerPoint. These tools often provide advanced features, such as real-time data syncing, integration with other data sources, and enhanced charting options.
Useful Tools to Create PowerPoint Slides from Excel Data
Think-cell Add-in for PowerPoint: Think-cell is a PowerPoint add-in that simplifies creating charts, tables, and Gantt charts. It integrates directly with Excel, allowing you to update charts and tables in real-time.
DataPoint add-in for PowerPoint: This add-in enables live data connections, ensuring your presentations are always up to date.
Tableau / Power BI: Both tools offer export options that let you insert dashboards or visualizations into PowerPoint presentations.
SlideModel’s PowerPoint Templates: If you’re looking for a faster, more efficient method, SlideModel templates can help. By using pre-designed Excel-to-PowerPoint templates, you can save time while ensuring a professional presentation format. SlideModel’s templates allow you to create stunning dashboards, financial reports, KPIs, and more, without the need to design everything from scratch. Especially designed for data-driven presentations and clean visuals, our templates help you create professional slides and import Excel data into PowerPoint.
SlideModel Templates for Excel to PowerPoint
SlideModel offers a variety of templates specifically designed for Excel-to-PowerPoint conversions. These templates can help you create stunning, professional presentations in minutes.
Recommended Categories:
- KPI Dashboards: Perfect for executive presentations and reporting.
- Finance & Budget Templates: Ideal for financial analysts and business consultants.
- Scorecards & Performance Tracking: Great for tracking progress and measuring success.
- Timeline & Roadmap Charts: Perfect for project managers and planners.
Using these Data and Dashboard PowerPoint Templates, you can quickly import your data into ready-to-use PowerPoint slides with professionally designed layouts. Below are a few examples of templates you can use to incorporate Excel data into PowerPoint.
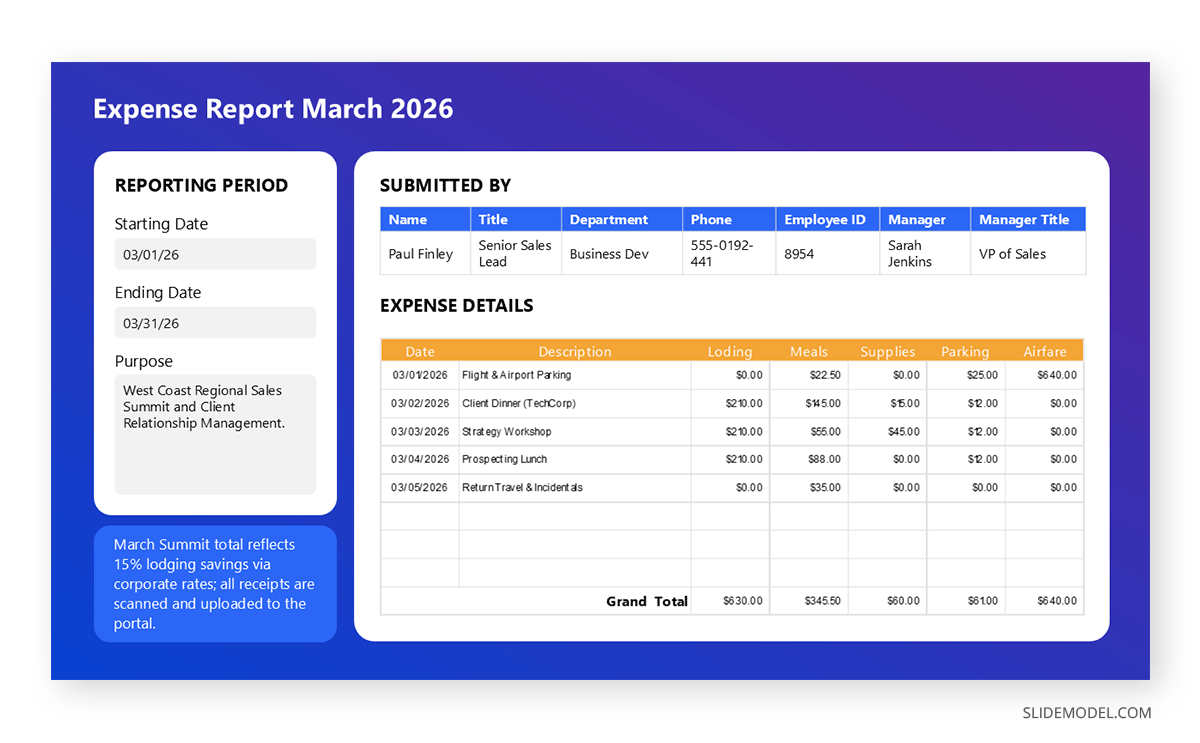
Expense Report PowerPoint Template
The Expense Report PowerPoint Template comes with a sample, editable layout where you can add Excel data to generate an expense report in PowerPoint. This is one of many SlideModel templates that enable adding Excel data to generate data-driven presentations.
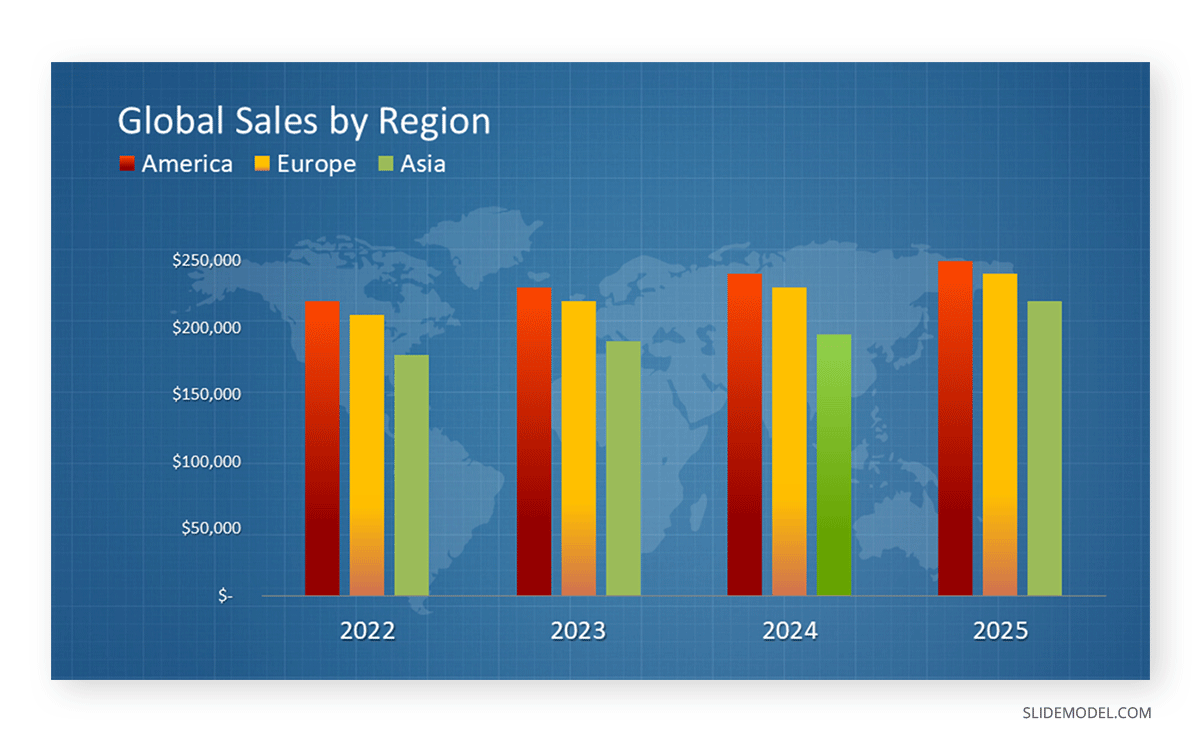
Sales Bar Chart PowerPoint Template
Chart templates at SlideModel can be conveniently used to import Excel data and paste it to create bar charts. Using PPT templates like this Sales Bar Chart PowerPoint Template, you can simply edit the sample charts in the template, which will open the editable Excel spreadsheet where you can paste required data to create professional-looking bar charts, such as sales charts, marketing information, budgetary, and other financial reports.
Radar Chart PowerPoint Template
For less frequently used data charts, such as radar charts, you can use the Radar Chart PowerPoint Template. You can copy your multivariate data from Excel and edit the sample radar charts, then paste them into the generated visualizations to detect outliers, perform a gap analysis, identify strengths and weaknesses, and conduct assessments.

Final Words
There are many ways to convert Excel data into PowerPoint slides, each with its own advantages and limitations. Whether you need a quick, one-time transfer using copy-paste or a more dynamic, automated solution using VBA or third-party tools, there is a method for every use case. For those who want to save time and ensure a polished presentation, SlideModel offers excellent templates that make the process quicker, easier, and more efficient.