Imagine running a charming little bakeshop. While it paints a delightful picture, the reality is that running a business, even as sweet as a bakeshop, entails numerous costs. From procuring quality ingredients for your delectable creations to acquiring resources to showcase and sell them, every step incurs expenses.
Businesses need financial clarity to determine these expenses and position themselves for success in a competitive landscape. This clarity is achieved through a comprehensive understanding of their Cost Structure.
Table of Contents
- What is Cost Structure
- Types / Characteristics of Costs
- How to Analyze Cost Structure
- Cost Structure Optimization Strategies
- Case Study: Netflix
- Conclusion
What Is Cost Structure
Alexander Osterwalder and Yves Pigneur provide a short and straightforward description of what a Cost Structure is in their book entitled Business Model Generation:
“The Cost Structure describes the most important costs incurred while operating under a particular business model.”
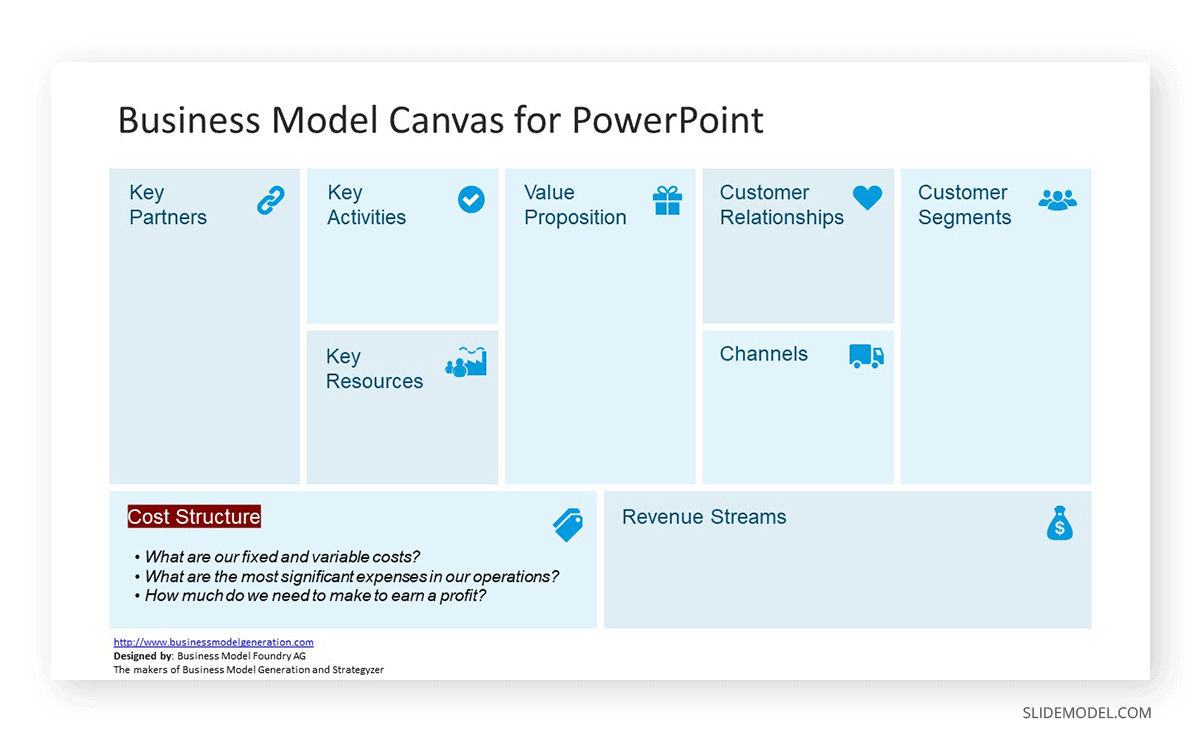
Cost Structure is part of the Business Model Canvas – also developed by Alexander Osterwalder – which comprises nine building blocks showing the logic of how a company intends to deliver value and make money. Within the cost structure block, entrepreneurs pinpoint the most significant expenses in their operations, precisely dissecting each cost.
We can easily ask ourselves these questions before approaching the Cost Structure:
- What are our fixed and variable costs?
- What are the most significant expenses in our operations?
- How much do we need to make to earn a profit?
While it entails the costs required to manufacture products or provide services, it goes beyond that, encompassing resources spent on other vital blocks of the business model, like maintaining customer relationships and channels.
Why is it important to come up with a cost structure? There are rippling benefits to undergoing this activity – setting appropriate prices, identifying revenue streams, reducing expenses, and more. We will discuss them in detail further down this article.
Types / Characteristics of Costs
The types of costs can be classified based on their behavior concerning changes in the activity level or production volume, namely fixed and variable costs. Classifying your costs into fixed or variable is the first step of Costs Structure analysis.
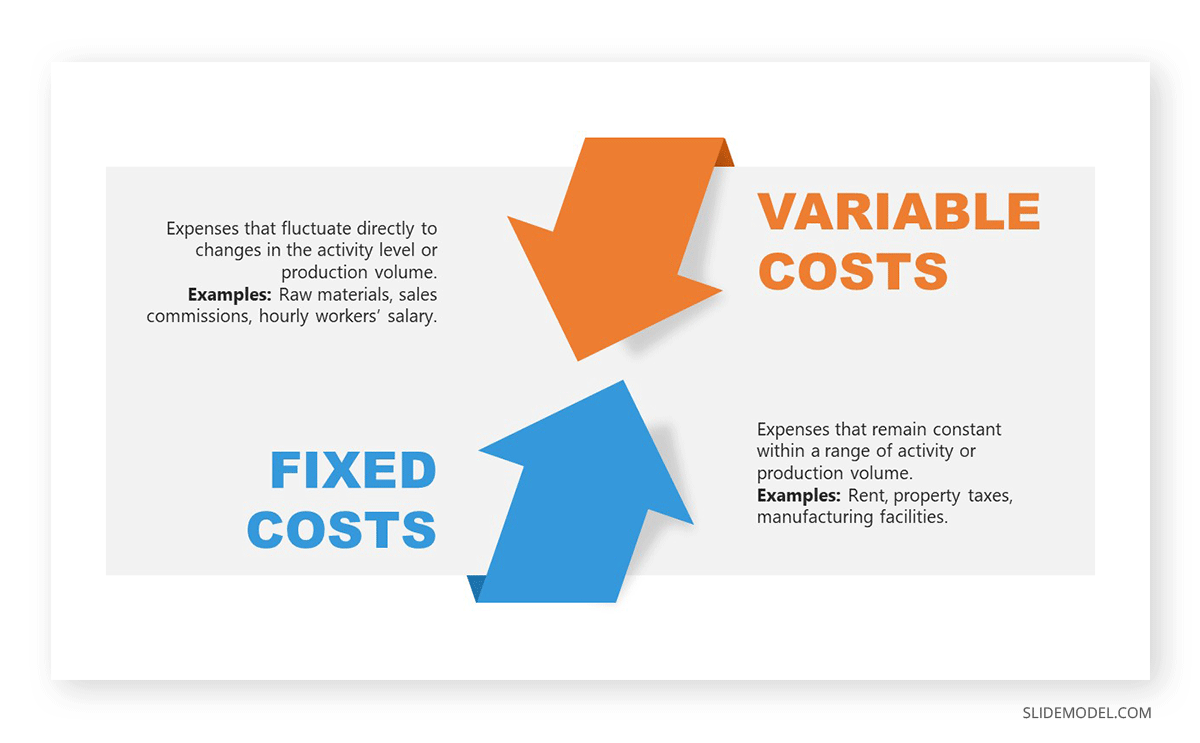
Fixed Costs
Fixed costs are the expenses that remain constant within a relevant range of activity or production volume. Regardless of whether the company produces more or less, fixed costs stay relatively stable. Examples of fixed costs are rent, manufacturing facilities, and property taxes.
Variable Costs
Variable costs are the expenses that fluctuate directly to changes in the activity level or production volume. As the company produces more product units or provides more services, variable costs increase, and vice versa. Examples of variable costs include the “Cost of Goods Sold” or the direct costs of making a product, like raw materials, sales commissions, and labor costs for hourly workers.
The behavior of costs can vary depending on the nature of the business and its operations. A cost that may be fixed for one type of business can be variable for another kind of business.
For example, for a small office-based business, utilities like electricity and water may have relatively fixed costs. The consumption levels may not vary significantly, leading to relatively stable utility expenses. However, utilities can be considered variable costs for a manufacturing plant or facility with variable production levels. As production increases, energy consumption and utility expenses will also increase.
Thus, every business must distinguish various costs as fixed or variable to rationalize expenses.
How to Analyze Cost Structure
Analyzing your company’s fixed and variable costs is fundamental in identifying effective cost-cutting strategies. Within this analysis, two distinct concepts come into play: Economies of Scope and Economies of Scale. Both of these concepts offer valuable perspectives on how to reduce costs effectively.
Economies of Scope
Economies of scope concentrate on the average cost of producing diverse goods or services within your company. It explores the cost advantages of producing multiple products or offering various services rather than producing each individually.
Economies of scope are particularly valuable when a business can efficiently diversify its offerings while leveraging fixed resources. By integrating certain activities, the company can reduce duplication of resources and streamline operations, resulting in cost savings.
Using airline companies as examples is a simple way to illustrate this concept.
Airlines that offer economy and business class can benefit from economies of scope by using the same aircraft. Rather than having separate planes for each class, the airline can optimize the use of its fleet, reducing the fixed costs associated with maintaining and operating multiple aircraft.
On top of that, offering business class provides an additional revenue stream that can help offset the cost of providing lower-priced economy-class tickets. It will also improve the likelihood of achieving higher load factors on flights, thereby spreading fixed costs over more passengers.
Economies of Scale
Economies of scale focus on the cost advantage gained from increasing the production level of a single product or service. As production volume rises, the average cost per unit decreases. This cost reduction occurs due to spreading fixed costs over a larger number of units, improved bargaining power with suppliers, and increased efficiency in production processes.
To illustrate the potential profit improvement from economies of scale, consider a phone manufacturing company that wants to purchase processors. Initially, the supplier offers 1000 processor units at a total cost of $50,000, which translates to $50 per unit. However, the supplier offers a discounted price of $75,000 if the phone manufacturer decides to purchase 2,000 units of the processor. At this volume, the per-unit price decreases to $37.5.
The potential profit improvement from economies of scale in this scenario is evident. The phone manufacturing company can reduce production costs by taking advantage of the discounted price, leading to higher profit margins for each phone manufactured.
Businesses should exercise caution and consider various factors before increasing production. Pursuing economies of scale without a thorough analysis of market demand can lead to overcapacity and potential losses if products go unsold. This brings us to the break-even analysis tool.
Break-even Analysis
Break-even analysis is a financial tool that determines the level of sales needed to cover all fixed and variable costs without making a profit or incurring a loss. To calculate the break-even point, you must know the contribution margin (selling price per unit and the variable cost per unit) and the total fixed costs.
The formula to calculate the break-even point in units is:
Break-even Point = Total Fixed Costs / Contribution Margin per Unit
Let’s return to our mobile phone manufacturing company to illustrate a break-even analysis.
Suppose the mobile phone manufacturing company has the following information:
- Selling price per unit: $599
- Variable cost per unit: $265
- Total fixed costs: $100,000
Now, let’s calculate the contribution margin per unit:
Contribution Margin per Unit = Selling Price per Unit – Variable Cost per Unit
Contribution Margin per Unit = $599 – $265 = $334
Next, we can calculate the break-even point in units using the formula:
Break-even Point (in units) = Total Fixed Costs / Contribution Margin per Unit
Break-even Point (in units) = $100,000 / $334
Break-even Point (in units) = 299.40
Since you cannot sell a fraction of a phone, we round up the break-even point to the nearest whole number. Therefore, the company needs to sell 300 mobile phones (or $179,700) to cover all its fixed costs and reach the break-even point, where it neither makes a profit nor incurs a loss.
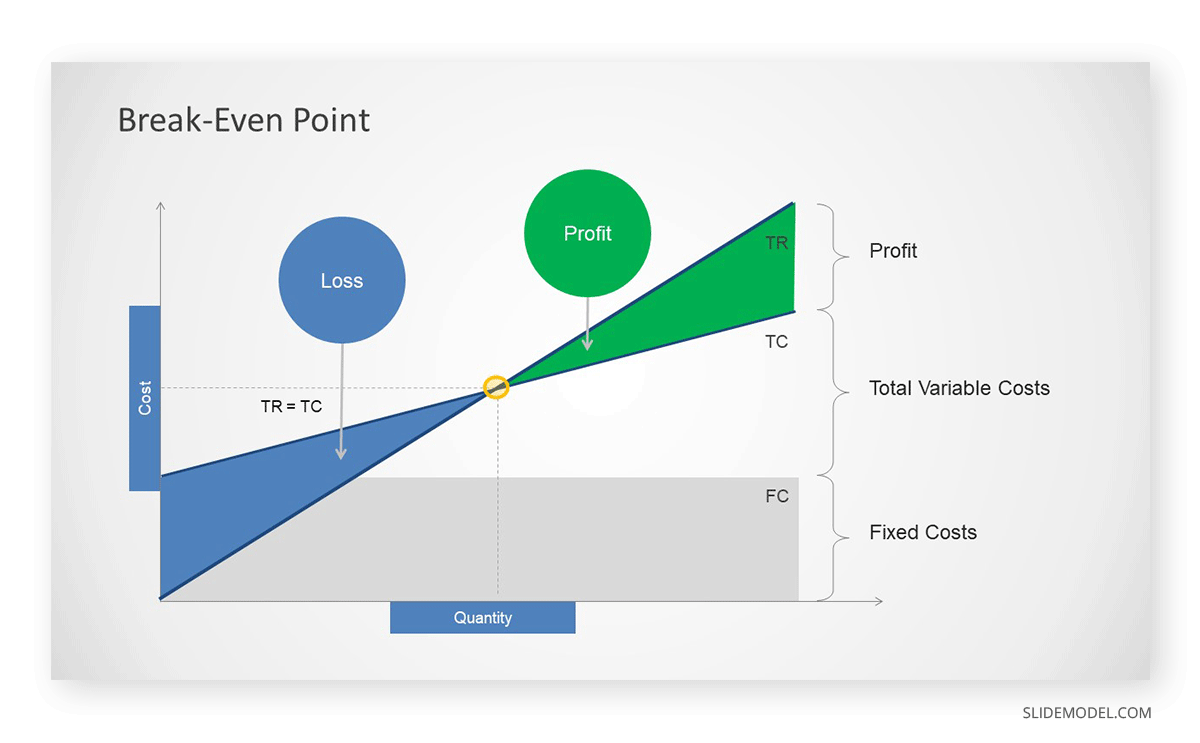
The company can present the break-even graphically to clearly understand the relationship between costs, sales volume, and profitability. It helps stakeholders, including management and investors, grasp the break-even point and profit regions more intuitively.
Once the break-even analysis indicates that the company needs to sell a certain number of units to cover all its costs, it needs to evaluate whether it can sell that number of units and whether there is sufficient demand in the market.
Cost Structure Optimization Strategies
1. Identifying Cost Drivers
AccounTools.com defines cost drivers as the factors that trigger a change in the cost of an activity. Cost drivers follow a cause-effect relationship, meaning they significantly impact the costs incurred by an activity or process. They can vary depending on the nature of the business and the specific activities or processes involved.
For example, in a manufacturing company, raw materials usage, machine hours, and work hours are the cost drivers as they directly impact the expenses that go into the manufacturing costs. Identifying these drivers allows businesses to optimize costs in specific areas to maximize efficiency and profitability.
If raw materials are significant cost drivers, the company can seek partnerships with suppliers to achieve economies of scale and reduce cost per unit. They may also outsource certain components or stages of the manufacturing process to reduce labor costs and machinery usage.
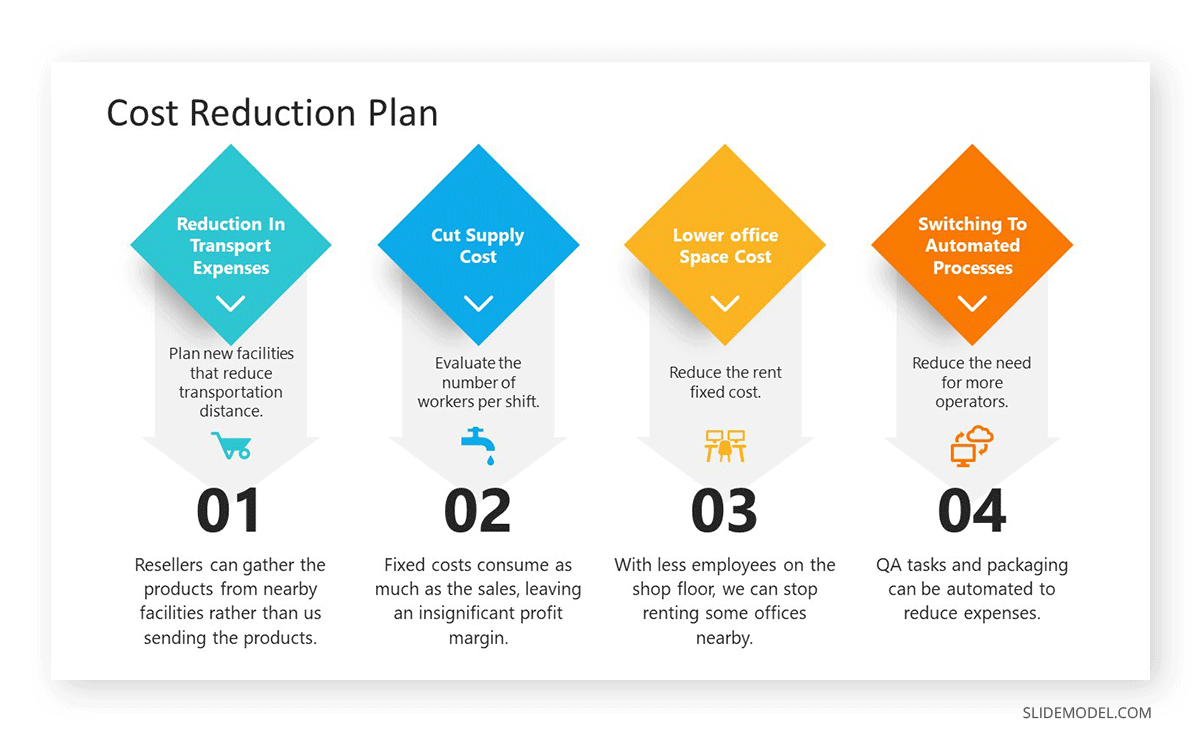
2. Eliminating Waste and Inefficiencies
Colloraly to the previous point, accounting for what drives up your operations cost will allow you to identify wastes and efficiencies in your processes and make rational decisions to eliminate them.
Going back to the manufacturing company example, if labor costs are pulling down the profit margin, investing in process automation may be the solution to optimize production efficiency. It will initially incur expenses, but automated processes can reduce labor hours and decrease the overall time required for production, thereby cutting costs in the long run.
3. Pricing Strategy Based on Cost Structure Optimization
Cost structure optimization is pivotal in shaping an effective pricing strategy that ensures a business remains competitive while safeguarding its financial health. That’s the whole point of conducting cost structure analysis. You want to ensure that you minimize cost, increase profitability, and, if needed, reduce consumer prices.
You can explore several pricing strategies based on the nature of your business.
- Cost-Plus Pricing – Pricing based on the total cost of producing a product or providing a service and adding a predetermined profit margin
- Value-based pricing – Pricing based on the customer’s willingness to pay (WTP) price and total production cost
- Dynamic Pricing – Pricing based on market conditions like demand and inventory levels
- Price Discrimination – Pricing that changes based on customer segments.
- Competitive Pricing – Pricing based on how rival businesses price their products or services
- Feature Dependent Pricing – Pricing based on the quality or number of features of the product purchased
Case Study: Netflix
Let’s explore how Netflix employs cost structure optimization to tailor its profitability and customer satisfaction pricing strategy.
Content licensing and production costs form a significant portion of their expenses (amounting to $21.83 billion in 2022) as they constantly strive to offer subscribers a diverse and engaging content library. On top of these, they also maintain technology infrastructure like data centers for streaming content. These comprise their fixed and variable costs.
To cover these costs, Netflix offers subscription plans targeting several customer segments with different preferences and budgets. It uses a mix of value-based pricing, price discrimination, and feature-dependent pricing.
In certain countries, like the U.S. and Canada, Netflix offers an ad-supported plan to entice consumers who want a cheaper alternative to the ad-free experience. This opens up another revenue stream for the company through ad placement fees from the advertisers.
In other developing countries, like the Philippines and India, Netflix has Netflix Mobile – a cheaper streaming service for phones or tablets void of advanced features like HD video quality and simultaneous streaming on multiple devices. By offering more cost-effective plans with specific limitations, Netflix can penetrate these markets and expand its global reach.
For their more expensive subscription tier, Netflix provides premium capabilities like adding extra members outside a household, full HD streaming, and spatial audio. These elements are critical for upselling users on cheaper options.
FAQs
What are the two main types of costs in a Cost Structure?
– Fixed Costs: Expenses that remain constant regardless of production levels, e.g., rent, salaries, and utilities.
– Variable Costs: Expenses that fluctuate with production volume, e.g., raw materials and commission payments.
How do fixed and variable costs differ across industries?
The classification of costs as fixed or variable can vary by industry. For example:
– Utilities: Fixed for small office-based businesses but variable for manufacturing plants.
– Raw Materials: Typically a variable cost for manufacturing but irrelevant for service-based industries.
What is Economies of Scope?
Economies of Scope refer to cost advantages when a company produces multiple products or services together instead of separately. For instance, an airline offering both economy and business class can share aircraft resources, reducing overall costs.
What is Economies of Scale?
Economies of Scale occur when increased production leads to a reduction in the average cost per unit. This is achieved by spreading fixed costs over more units and improving efficiency.
What are the common strategies for Cost Structure optimization?
– Identifying Cost Drivers: Analyze factors like raw materials or labor that significantly impact expenses.
– Eliminating Waste and Inefficiencies: Streamline operations to reduce unnecessary costs.
– Using Pricing Strategies: Implement cost-plus, value-based, dynamic, or competitive pricing based on business needs.
How can small businesses apply Cost Structure analysis?
Small businesses can:
– Categorize expenses as fixed or variable.
– Use break-even analysis to set pricing.
– Optimize operations by identifying and addressing cost drivers like raw materials or staff hours.
Conclusion
Cost Structure Analysis is an unskippable step of business planning. By analyzing fixed and variable costs, businesses can identify cost-cutting strategies, set appropriate prices, and maximize efficiency. Whether running a simple bakeshop or a company as big as Netflix, your cost structure will guide your businesses toward sustainable growth.