Google Slides vs. PowerPoint: A Detailed Comparison
Contrast and pick with presentation software suits your best. Check our guide on how the Google Slides vs. PowerPoint eternal debate.

How to Insert an Equation in PowerPoint
Learn how to create easy-to-understand science slides by mastering how to insert an equation in PowerPoint. Step-by-step guide.

Using VBA to Create Certificate Slides in PowerPoint from a List of Names
This article explores how you can use PowerPoint and Visual Basic for Applications (VBA) to automate the generation of certificates for groups of people. Organizations frequently require personalized certificates for participants in events, courses, or training sessions. Microsoft PowerPoint is often used to generate those certificates, mainly because plenty of editable certificate templates are available that […]

How to Remove Notes from PowerPoint
Make alternative versions of your presentation files by learning how to remove notes from PowerPoint. Step-by-step guide with screeshots.

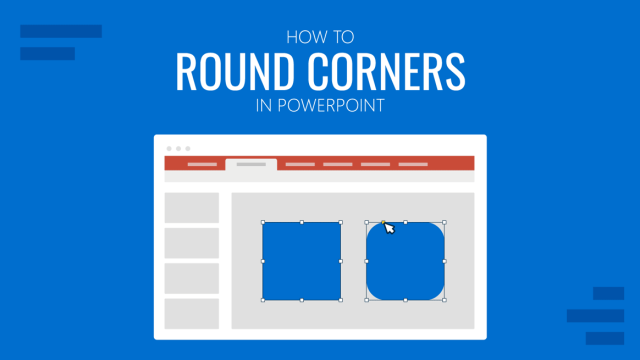
How to Round Corners in PowerPoint
Learn how to add rounded corners to shapes and images in PowerPoint. Elevate your presentations with sleek designs. Expert tips and step-by-step guides.

How to Add Subscript and Superscript in PowerPoint
Using subscript and superscript in PowerPoint shouldn’t be a challenge. Learn how to properly use these two special type symbols with this guide.

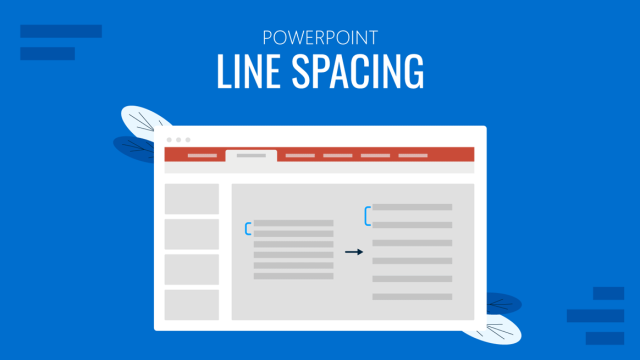
How to Change Line Spacing in PowerPoint
Adjust text formatting by learning how to change line spacing in PowerPoint. Instructions for paragraph indenting included.

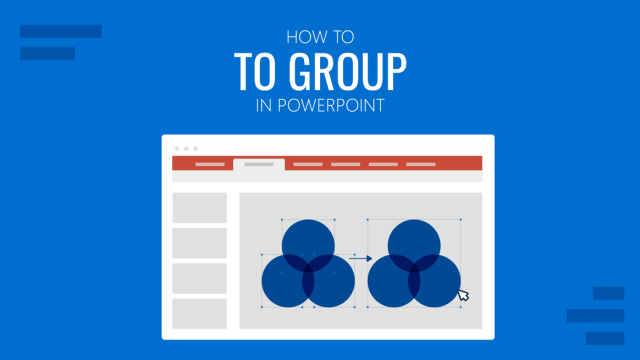
How to Group Shapes in PowerPoint
Organize your slides’ content efficiently by mastering how to group in PowerPoint. 3 different approaches to grouping and ungrouping elements.

How to Create an Action Button in PowerPoint
Create engaging presentation slides by learning how to make an action button in PowerPoint. Add CTAs to your slides in just minutes.

How to Add Bullet Points in PowerPoint
Become a master of summarizing presentation’s key points by learning how to add bullet points in PowerPoint

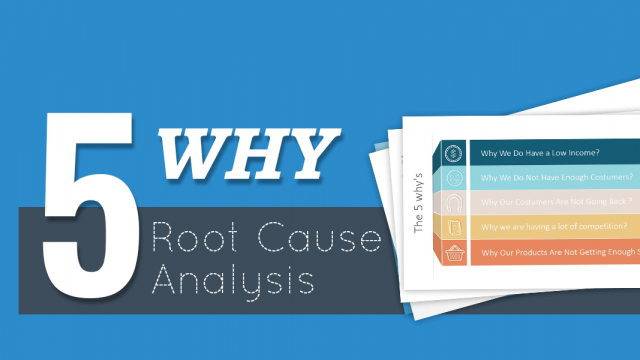
How To Present a 5 Why’s Root Cause Analysis
The regular rut of life or the professional wheel, problems can leave you fumbled and dumbstruck at any bend of the road. Mostly unforeseen and uninvited, some problems can have you at your knees while others can bring you to the wits end in an instant. Irrespective of which realm of life you encounter a […]

How to Outline Text in PowerPoint
Add creative effects to your slides by learning how to outline text in PowerPoint. An ideal solution to make texts stand out.