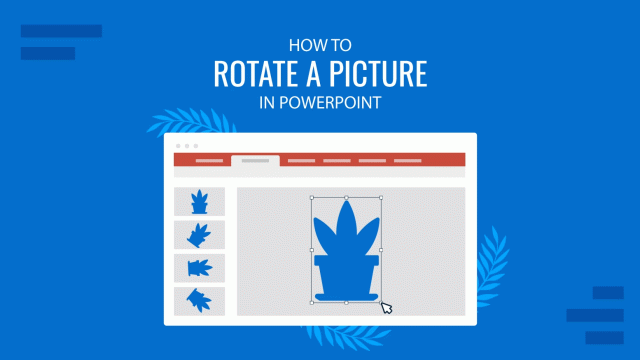
How to Rotate a Picture in PowerPoint
Sometimes, one has the perfect picture for a presentation that seems to be crooked or needs to be rotated to correct its alignment. At other moments, one might want to rotate an image to present a different perspective before an audience. Luckily, it would be best not to waste time using an image editor to […]

How to Cite a PowerPoint in APA
Learn how to correctly apply the APA style in your presentations by learning how to cite slides, books and images in APA in PowerPoint.

How to Add Page Numbers in PowerPoint
If you wondered how you can speed up your slide numbering process, then stay tuned for this article on how to add page numbers in PowerPoint
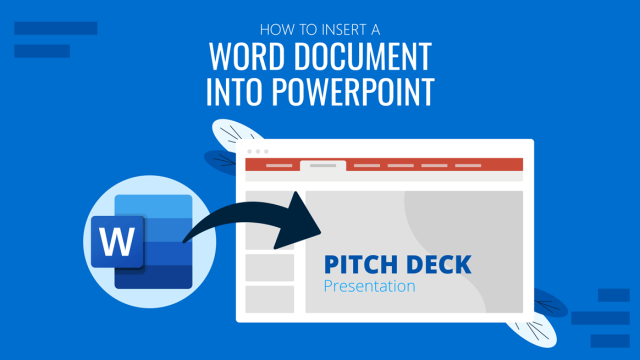
How to Insert a Word Document into PowerPoint
If you asked yourself how to link research data in .doc format into your presentations, then don’t miss our guide on how to insert a Word document into a PowerPoint file.
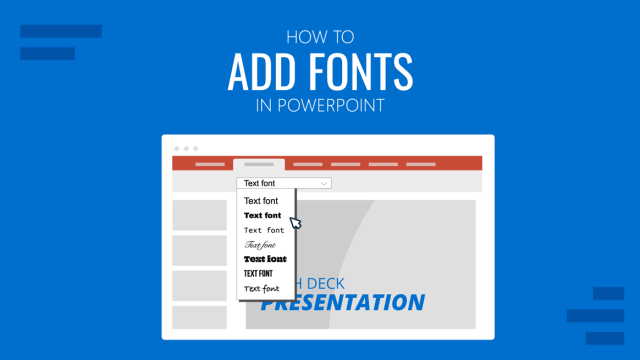
How to Add Fonts to PowerPoint
Create custom presentation slides by learning how to add new fonts in PowerPoint. Step-by-step guide.
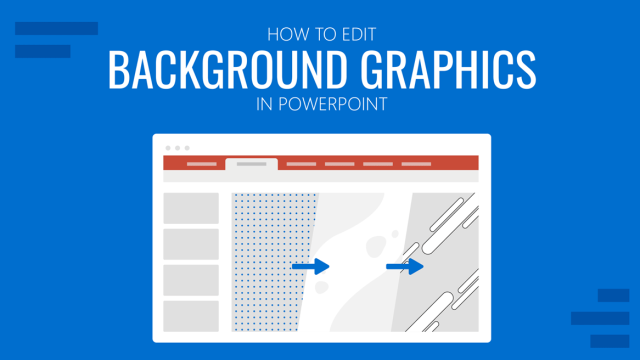
How to Edit Background Graphics in PowerPoint
You don’t have to stick with template designs that don’t appeal to your intended message. Learn how to edit background graphics in PowerPoint to become a master user.

How to Track Changes in PowerPoint
Just like with Google Slides, you can check who made adjustments to your files in collaborative work. Learn how to track changes in PowerPoint here!

How to Create a Roadmap in PowerPoint
Learn how to create effective roadmap presentations in PowerPoint with this step-by-step guide and recommended templates.

How to Copy a Slide in PowerPoint
Optimize your slide deck creation process by learning how to copy a slide in PowerPoint. Detailed instructions with screenshots here.

How To Insert Many Pictures into Individual Slides in PowerPoint
There are many reasons why you may be interested to insert many pictures into individual slides at once using PowerPoint. For example, if you’d like to protect your PowerPoint presentations by avoiding users to change editable fields or data values, then importing the slides as pictures into a new presentation could be a possible approach. If you […]
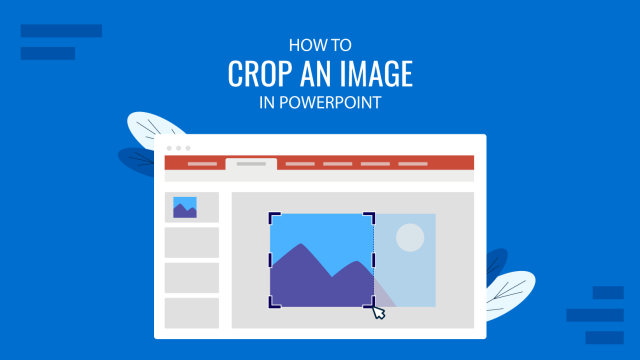
How To Crop an Image in PowerPoint
Images play a crucial role in enhancing the visual appeal of your PowerPoint presentations. Whether you’re trying to highlight a specific part of a photo, remove unnecessary elements, or create custom shapes, the cropping tool can be helpful to enhance the presentation design. In this article, we’ll explain you how to crop images in PowerPoint, […]

How To Create Online Courses
The e-learning industry keeps growing at a rapid pace. By 2025, it is expected to reach $325 billion, up from the estimated $107 billion last year. What’s even more interesting is that online courses specifically comprise $46 billion of the total e-learning market. These numbers should come as no surprise as teaching online has become […]