Cluster Analysis Concept Diagram for PowerPoint
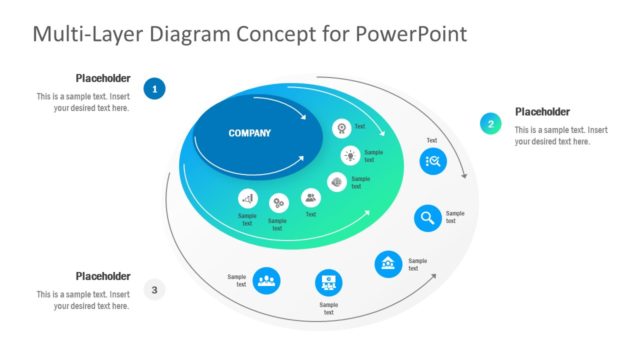
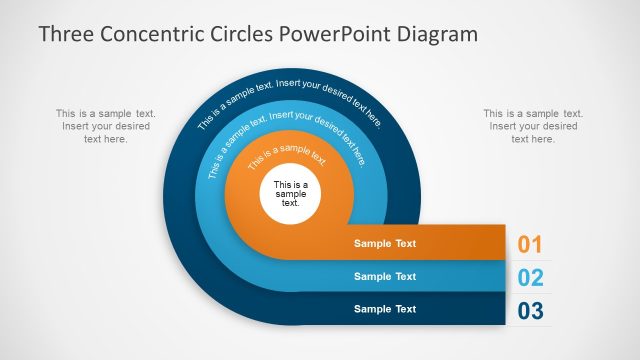
Organize information for a dynamic presentation using the Cluster Analysis Concept Diagram for PowerPoint. The slide designs contain different variations of the diagram, to fit any type of purpose.
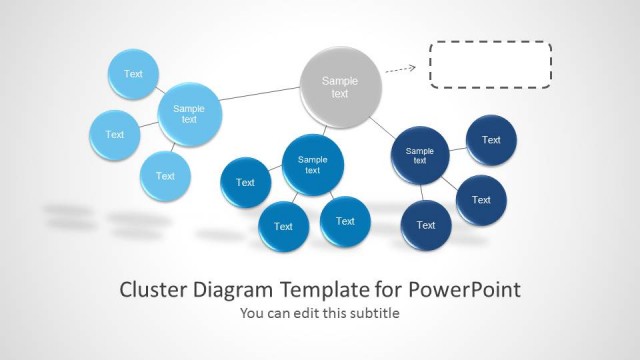
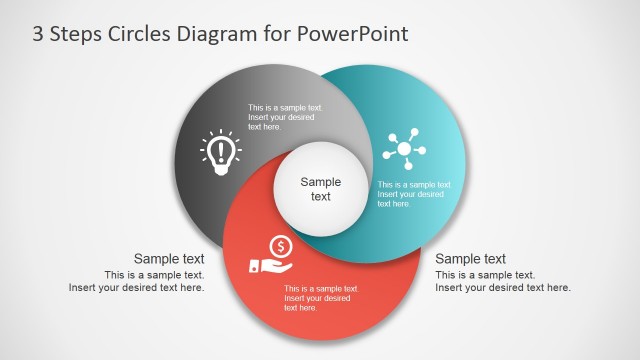
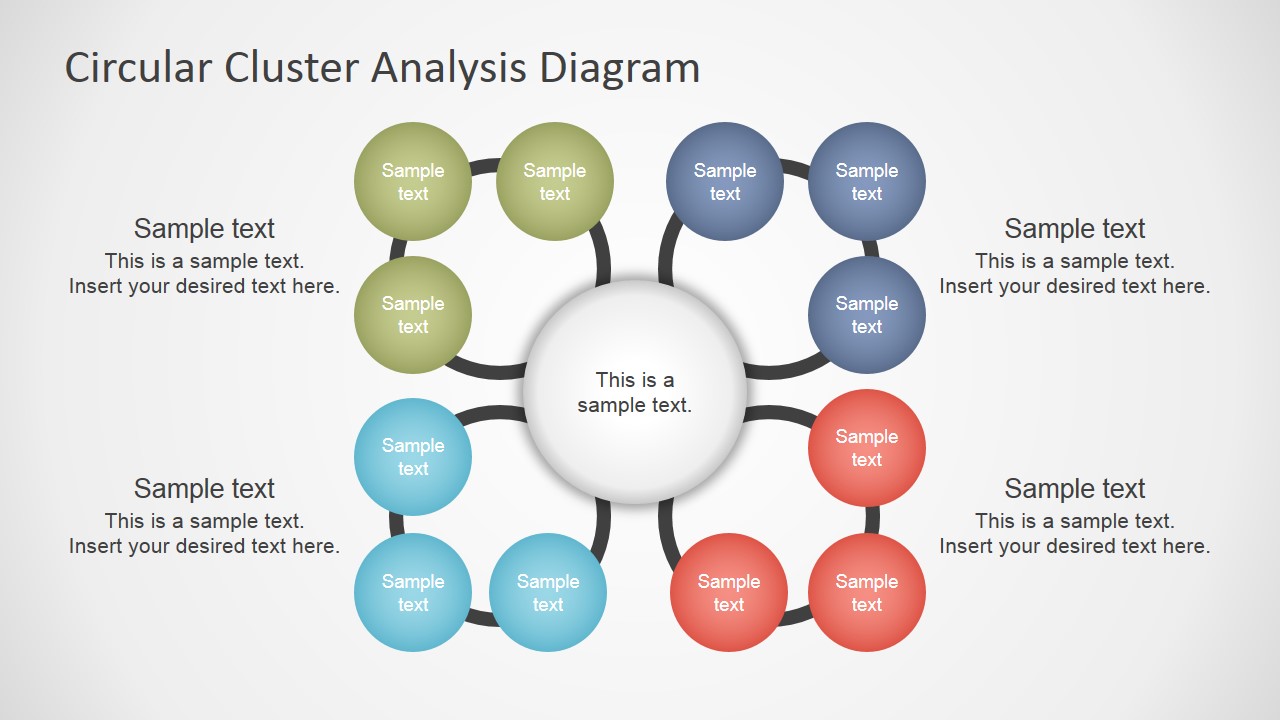
Cluster Analysis is a type of brainstorming and analysis technique that uses diagrams to track patterns. This is executed by grouping sources that contain similar terms or values. Using this type of diagram, the specific similarities and differences of certain sections of data can be highlighted. The user can group related subsets of data and present the summarized conclusions using each of the cluster containers in the presentation.
With its clean and professional look and feel, the slide designs are applicable to brainstorming sessions for discussing a business plan or new strategy. The cluster analysis diagram allows the user to highlight any flaws or deficiencies in the plan in order to make sure that all loose ends have been tied.
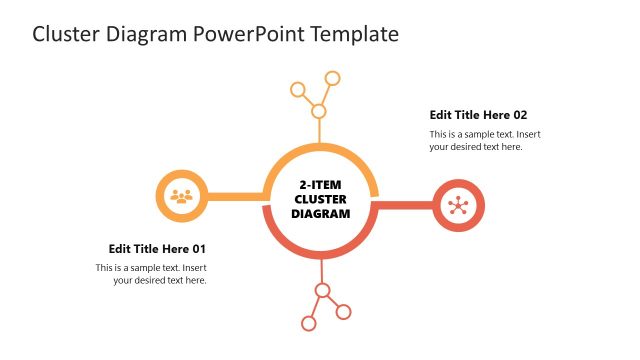
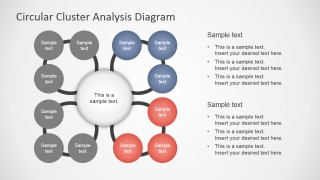
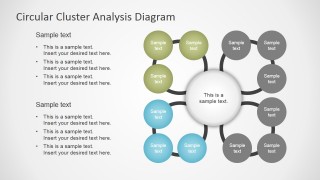
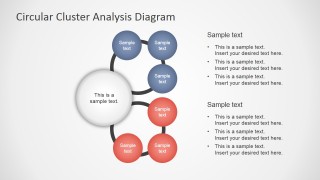
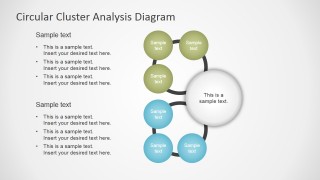
The basic design of the PowerPoint template is a large circle at the middle of the slide. It contains a text placeholder and a blurred gray outline. Four circular outlines intersect the circle to form four quadrants. On each circular outline is a set of three smaller circles with gradient fills. The colors of the quadrants differ, such as blue, green, cyan, and red. The template contains slides where one half of the quadrants are filled in with black, while the other half remains colored. This type of design emphasizes two quadrants so that their characteristics can be analyzed.
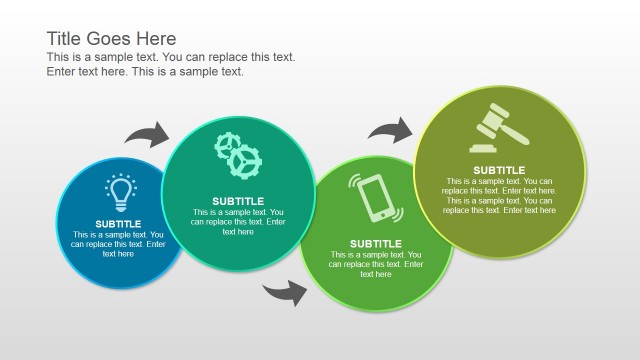
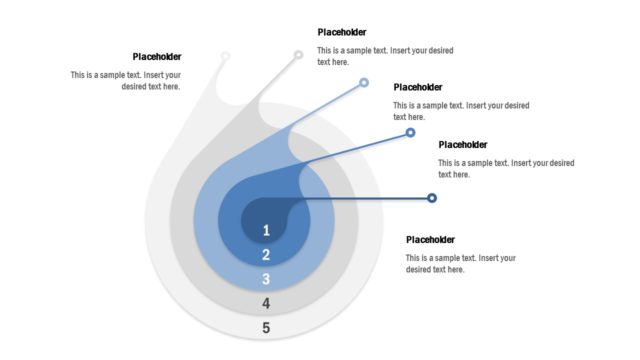
The Cluster Analysis Concept Diagram for PowerPoint is most suitable for projects that have different stages or parts. With the use of the template, the presenter can effectively sort out any redundancies and errors in the described sequence. The PowerPoint objects in the PowerPoint template are fully customizable, so that the content can be smoothly fitted to the corresponding audience.
The users can browse and download any of the PowerPoint Templates of our gallery and complement the Cluster Analysis Concept Diagram with additional layouts and graphics.


You must be logged in to download this file.
DOWNLOAD- Category
- Diagrams
- Rating


 Loading...
- Size
- 16x94x3
- Item ID
- 7061-01
- Colors
Subscribe today and get immediate
access to download our PowerPoint templates.