US Map Template for PowerPoint with Bubbles – United States of America, commonly known as U.S., is composed of 50 states of almost 10 sq. km. geographical territory. It makes up most of the Northern American map. The template is a combination of cool and warm color scheme. The design is an efficient tool for comprehensive presentations. Supplement reports with US Map Template for PowerPoint with Bubbles for high-standard outputs.
The PowerPoint template is ideal for business presentations. It can be used to incorporate finance to a macro-level concept. The figures in the default design can represent marketing goals or current production status. The design can show real estate territories and their quantitative values. The features on the layout can be fully personalized. Hence, the user can choose to alter the context and design anytime. Use the PowerPoint shapes menu option to quickly alter any object in the Microsoft template.
US or USA is a federal republic or a collection of different states with their individual governments. Its main language is English. It has Washington DC as its capital. It is one of the initial civilizations and has a very rich history. It is considered as one of the pillars of global economy. It is a first-world republic with high-standard technology. It continues to level up its development and influence.
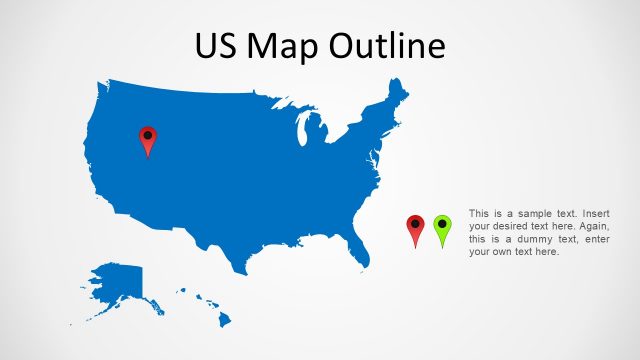
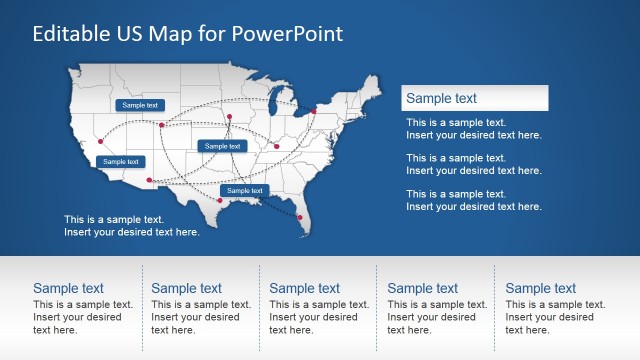
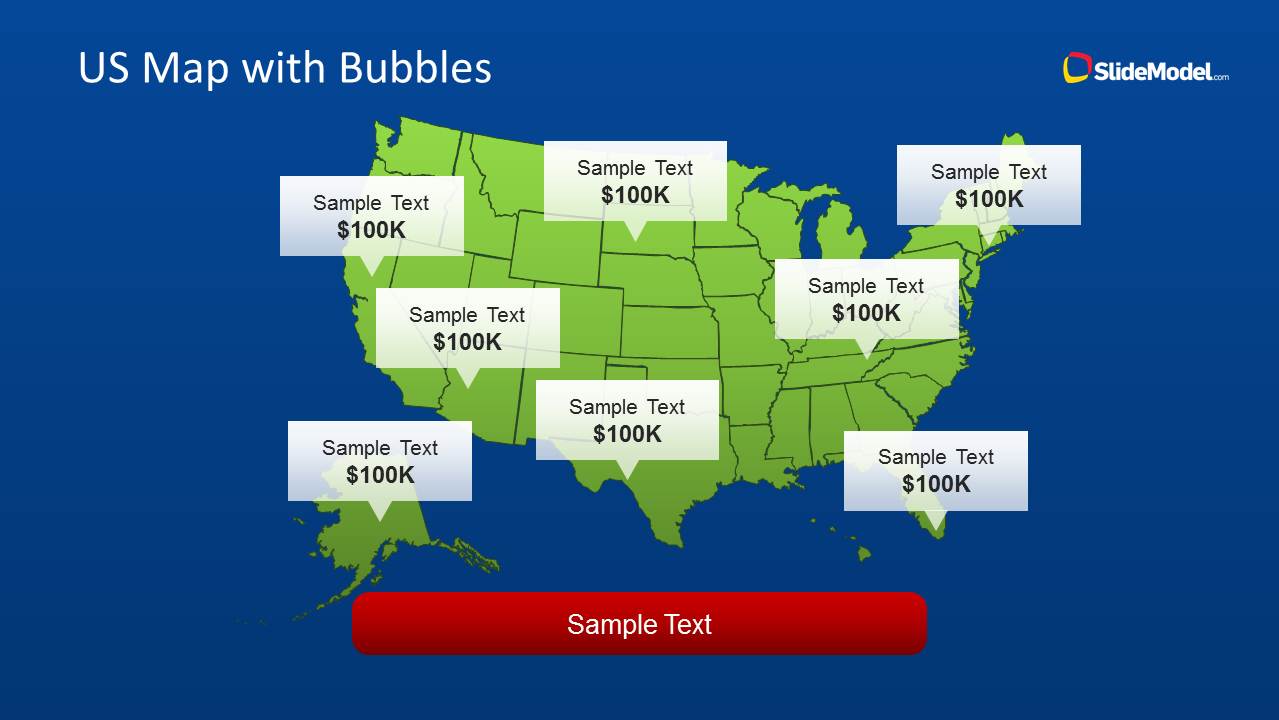
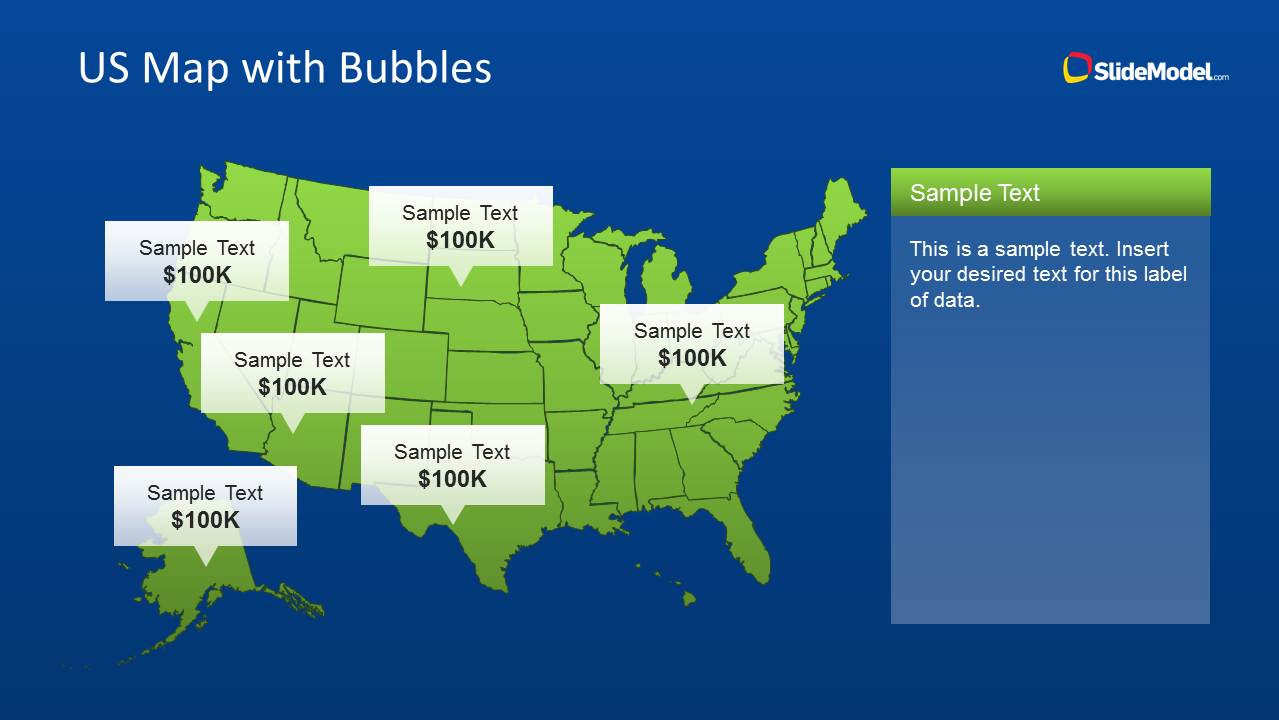
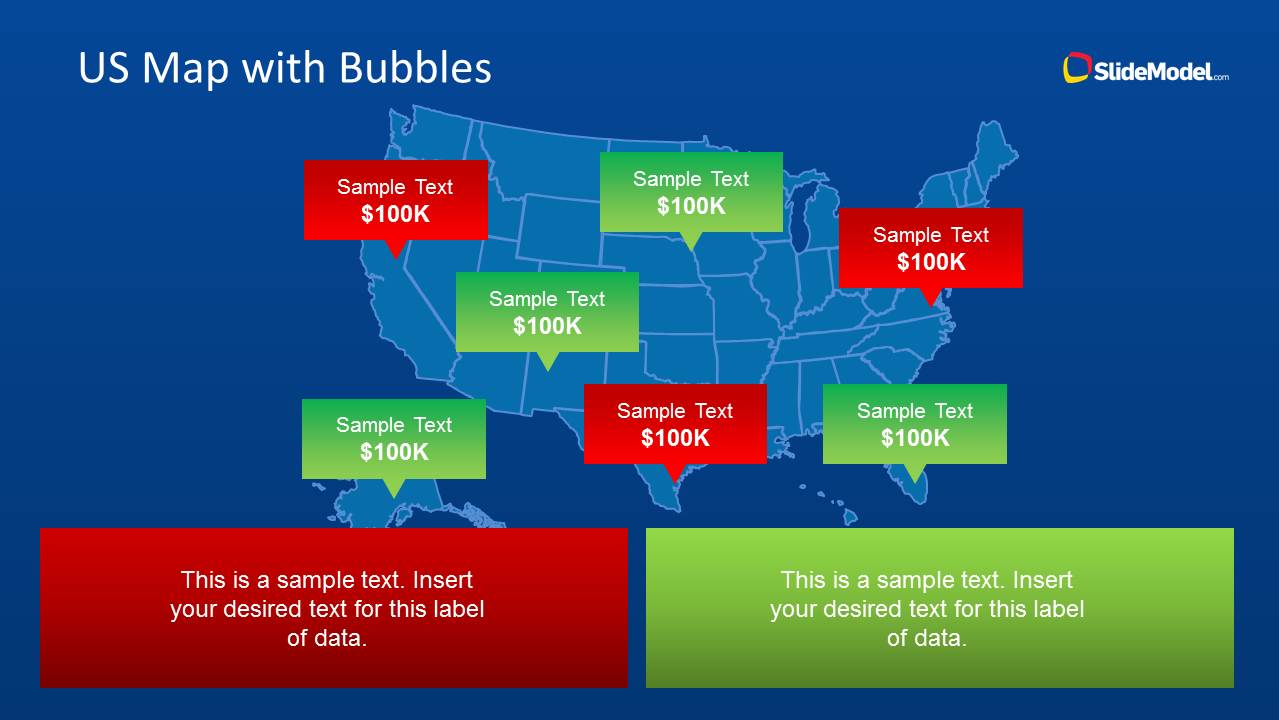
The first slide includes an outline of the US map. It is filled with bright green shade and black shape outlines. Bubble text shapes overlap some of the states. The text boxes have $100 labels. The presenter can edit this text and replace it with exact figures that fit the presentation. The second slide has the same main picture except for the text placeholder on the right. Lastly, the last slide has red and green bubble text boxes.
For classic presentations, use US Map Template for PowerPoint with Bubbles. Checkout US Map Template for PowerPoint with Editable States at the SlideModel gallery to download the design.
What’s inside this template
Example presentation scenarios
- A sales manager can present regional revenue targets by replacing the bubble labels on the full US map with territory values and using the bottom banner for the national target.
- A finance analyst can explain geographic variance by using the map with the right-side note panel to pair state-level callouts with a short explanation of assumptions or drivers.
- An operations leader can compare locations that are on track versus at risk by using the red and green bubble map and the two bottom callout blocks for summary messages.
- A real estate presenter can show market coverage across US regions by mapping site counts or opportunity values into the editable bubbles.
Features
- 100% editable presentation template
- Compatible with Microsoft PowerPoint and Google Slides
- Scalable vector shapes, icons and illustrations
- AI-Ready for Microsoft Copilot and Claude
- Instant access and download
Frequently asked questions
Q: How should a presenter communicate values without overloading the US map?
A: Keep each bubble to one clear metric, such as sales, locations, pipeline value, or status. Use the map to show geographic spread, not detailed calculations. Put the key takeaway in the bottom banner or side panel, then explain only the regions that matter most to the decision.
Q: Who is this template best suited for?
A: This template fits business presenters who need a quick national view of regional performance, territory assignments, or market coverage. Sales, finance, operations, and real estate teams can use the bubble callouts to attach numeric values to US regions while keeping the message understandable for executives or clients.
Q: Why use bubble callouts instead of a table or plain US map?
A: The bubbles create a direct visual link between a region and its metric, so the audience can scan location and value together. The red and green version also adds a status metaphor, making positive and negative signals easier to separate before the presenter adds detail verbally.
US Map Template for PowerPoint with Bubbles
3-slide PowerPoint map template with US bubbles and state territory labels
US Map Template for PowerPoint with Bubbles is a 3-slide editable US map infographic for territory, sales, finance, and operations reporting. It includes a full US map with regional bubble labels, a map with side note panel, and a color-coded bubble map with bottom callout blocks.

 Loading...
 Microsoft PowerPoint
  Microsoft Copilot
  Claude for PowerPoint
 Other formats supported
Subscribe today and get immediate
access to download our PowerPoint templates.