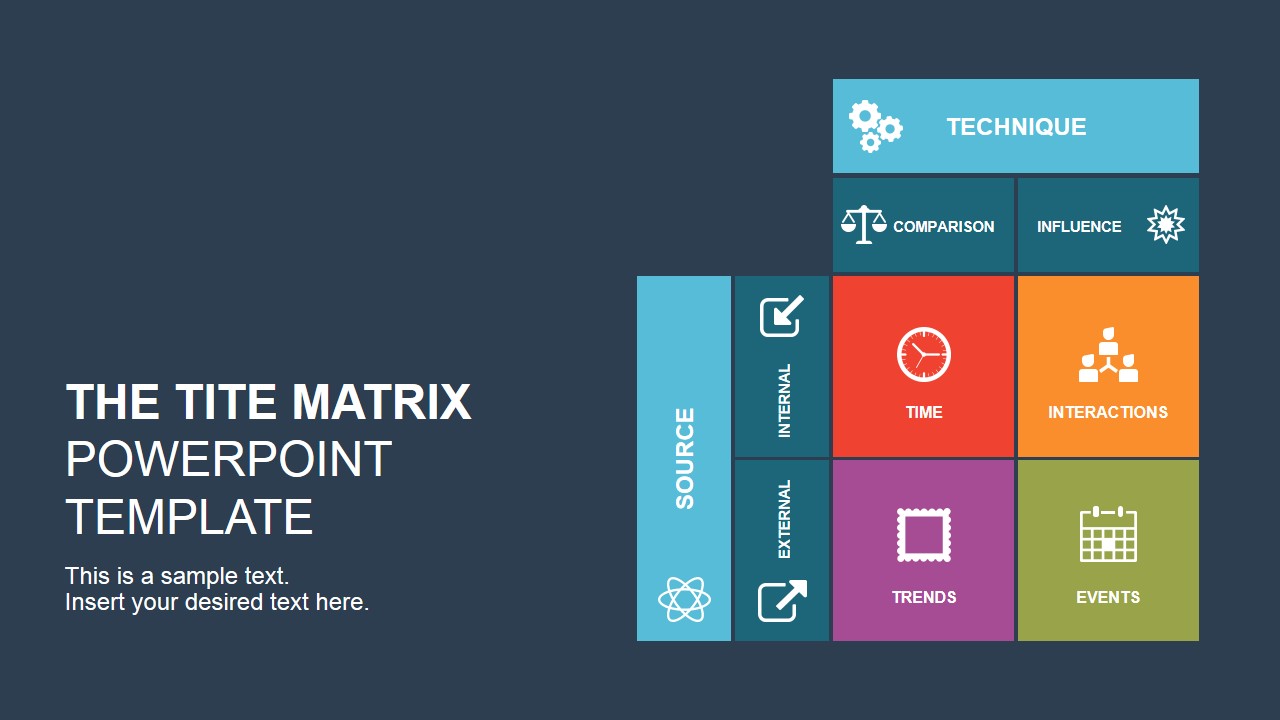
The TITE Matrix PowerPoint Template – Create Data Analytics Strategies with the TITE Matrix, a Matrix for Better Decision Making. Turn your data points into something meaningful. The professional template allows presenters and data scientists to describe their data analytics strategies through the use of the TITE framework.
What’s inside this template
Example presentation scenarios
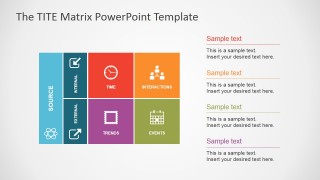
- A data analyst can use the full TITE matrix to explain how internal and external sources connect to technique categories before a modeling or reporting project.
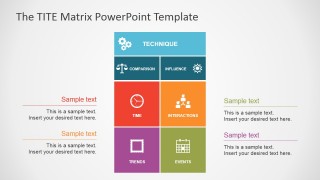
- A marketing strategist can use the four-callout slide to brief a team on how Time, Interactions, Trends, and Events affect campaign planning.
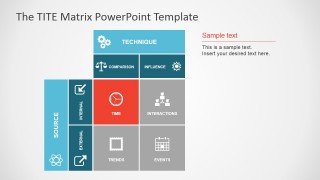
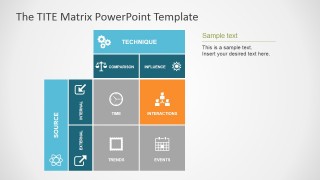
- A consultant can use the focus-state matrix slides to walk executives through one quadrant at a time during a decision-making workshop.
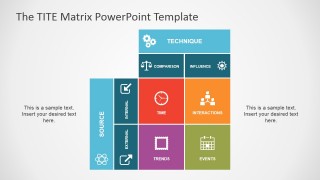
- A business intelligence lead can use the overview slide with side notes to align stakeholders on the structure of an analytics roadmap or data-mining initiative.
Features
- 100% editable presentation template
- Compatible with Microsoft PowerPoint and Google Slides
- 16:9 aspect ratio slides
- Scalable vector shapes, icons and illustrations
- AI-Ready for Microsoft Copilot and Claude
- Instant access and download
Frequently asked questions
Q: How should a presenter explain the TITE matrix without overwhelming the audience?
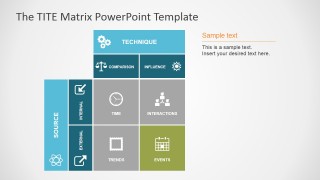
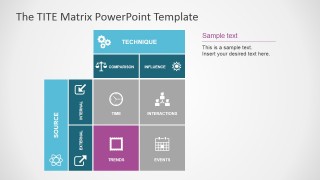
A: Start with the full matrix to define the two organizing ideas: Technique across the top and Source down the side. Then use the four-callout slide to assign meaning to each quadrant. Finish with the focus-state slides so the audience studies Time, Interactions, Events, and Trends one at a time instead of reading the whole grid at once.
Q: Who is this template best suited for in a business presentation?
A: This template is best for analysts, marketers, consultants, and business intelligence teams who need to turn abstract data inputs into a shared decision model. It works well in strategy meetings, data discovery sessions, and content marketing planning because the matrix links source type, technique, and business interpretation in one view.
Q: Why does the design repeat the same matrix with different highlighted quadrants?
A: The repeated matrix creates continuity while the gray-out treatment controls attention. Audiences do not need to relearn the diagram on every slide; they keep the same mental map and shift focus to one category. This is useful for explaining a model because comparison, emphasis, and recall stay visually connected.


The TITE Matrix PowerPoint Template
8-slide presentation template for TITE matrix data analysis and marketing decision frameworks
The TITE Matrix PowerPoint Template is an 8-slide diagram presentation for structuring data analytics and marketing decisions around Technique, Source, Time, Interactions, Trends, and Events. It includes a cover, full TITE matrix, matrix with side notes, four-callout explanation slide, and focus-state matrix variations for Microsoft PowerPoint and Google Slides.
- Category
- Models
- Rating


 Loading...
- Aspect ratio
- 16:9, 4:3
- Item ID
- 7062-01
- Colors
 Microsoft PowerPoint
  Microsoft Copilot
  Claude for PowerPoint
 Other formats supported
Subscribe today and get immediate
access to download our PowerPoint templates.