Excel PowerPoint Templates
Turning raw Excel data into an audience-friendly format can be time-consuming and design-intensive. Our Excel PowerPoint templates are built to solve that. Designed for professionals who regularly report KPIs, analytics, forecasts, or project metrics, these Excel presentation templates allow seamless transition from spreadsheets to slides.
Whether you’re a financial analyst, marketing executive, or operations lead, you’ll save time and avoid formatting headaches while delivering precise insights in a polished format. Download today!
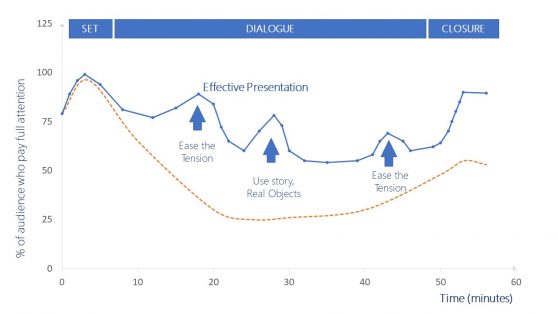
Audience Attention Curve Effective Presentation
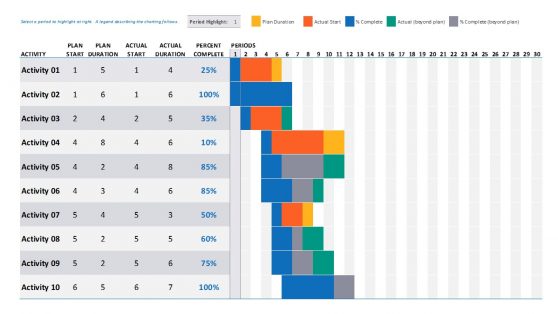
Data Driven Gantt Chart PowerPoint Templates
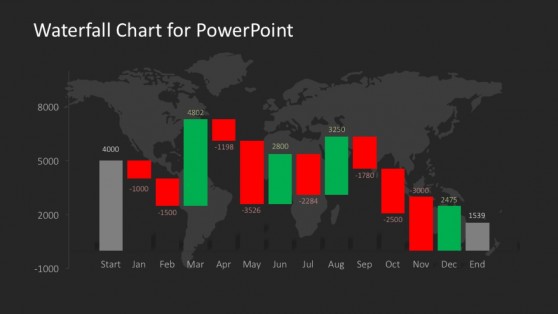
Data Driven Waterfall Chart for PowerPoint
What Is an Excel Presentation Template?
An Excel presentation template is a pre-formatted PowerPoint slide deck specifically designed to showcase data from Excel files. It can include data-driven charts, dashboards, tables, Gantt charts, and infographics that are tailored to display trends, comparisons, and projections clearly.
Excel PPT template files often provide placeholders for copying and pasting Excel visuals, or embed editable charts linked to Excel data for automatic updates. These templates are indispensable for data-intensive environments such as finance, operations, logistics, education, and research.
Why Use Excel PowerPoint Templates in Data-Driven Presentations?
Excel data presentation templates streamline the process of translating complex spreadsheets into clear and visually engaging slides. Instead of manually adjusting fonts, axis labels, or chart legends, presenters can use the built-in structure of these Excel PPT template files. This leads to a reduction in errors, improved readability, and increased credibility.
For recurring reports, such as monthly financial statements or sales performance, reusing an Excel presentation template ensures consistency and brand alignment across all decks.
How Professionals Use Excel PowerPoint Templates to Communicate Results
Finance teams use Excel PPT template decks to present P&L statements, revenue breakdowns, and quarterly forecasts. Project managers rely on Gantt-style Excel data presentation templates to track milestones and delivery status. Marketing teams visualize ROI, CTR, and performance data directly imported from spreadsheets.
Academic researchers and scientists present statistical results using Excel PowerPoint templates with built-in chart placeholders. Business consultants use Excel presentation templates to deliver client dashboards, benchmarking visuals, and scenario planning slides.
Speed Up Slide Creation While Reducing Design Complexity
Creating PowerPoint visuals from scratch for Excel data can take hours, especially when deadlines are tight. These Excel presentation templates offer pre-built layouts with smart formatting, data zones, and visual hierarchy already in place. Instead of fiddling with axis settings or alignment, users can copy data from Excel and populate visual placeholders in minutes. This allows analysts and presenters to focus on message clarity and narrative flow.
What are Excel presentation templates used for in professional settings?
They help present spreadsheet data clearly through charts, tables, and structured layouts.
Can I link Excel data directly into an Excel PPT template?
Yes. Many templates support embedded or linked charts for auto-updating visuals.
Are Excel data presentation templates compatible with older PowerPoint versions?
Yes. They are provided in .pptx format, suitable for most modern and legacy versions.
Can I reuse the same Excel PPT template for different reports?
Yes. You can save templates and duplicate them for monthly, quarterly, or custom reporting cycles.