Download Diagrams for PowerPoint
This category contains awesome diagrams for PowerPoint presentatations with unique slide designs and styles. Download diagram templates for PowerPoint presentations containing different types of diagrams like tree diagrams, process flow diagrams, circular or cycle process diagrams, popular business & strategy diagrams like the SWOT templates and more.
Featured Templates
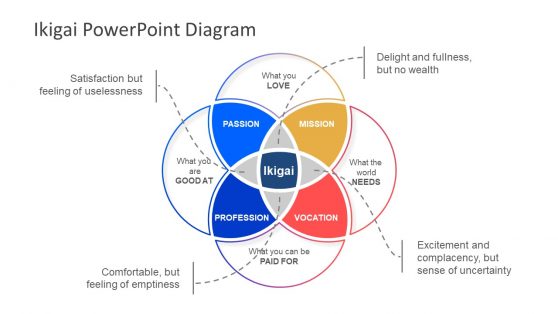
Ikigai PowerPoint Diagram Template

5W1H Framework PowerPoint Diagram
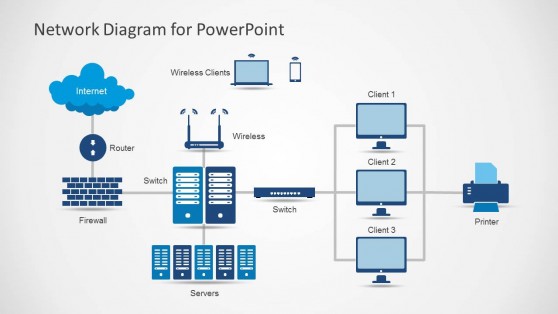
Network Diagram Template for PowerPoint
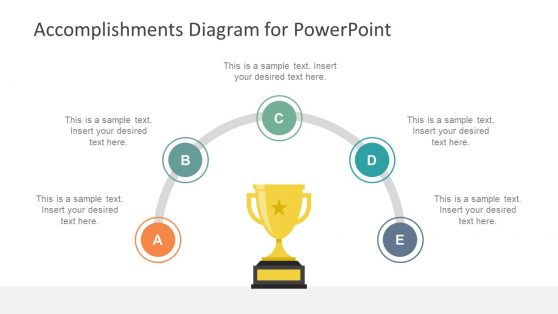
Accomplishments Diagram for PowerPoint

Attribute-Based Access Control Diagram PowerPoint Template

Animated 4 Steps Neumorphic PowerPoint Diagram

5-Item Horizontal Step-by-Step Cards PowerPoint Template
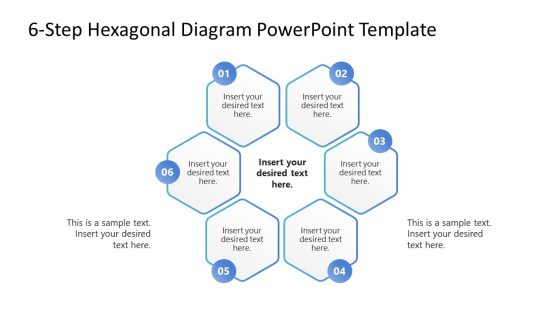
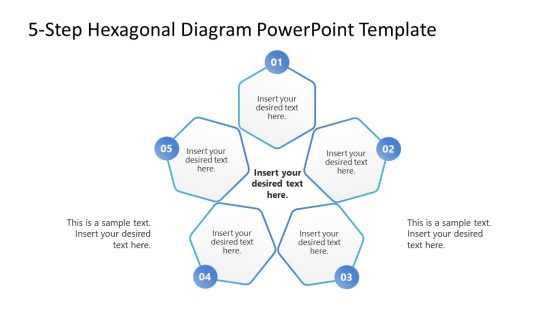
6-Step Hexagonal Diagram PowerPoint Template
PowerPoint Diagram Templates are slide designs and styles containing images creatively embedded in the structures with the proper color to communicate with the users’ audiences. Our Diagram PowerPoint templates assist in converting boring textual data into more visually appealing graphics and diagrams that are easier to understand at a glance for the audience. Because of the interactive design of the template, users can incorporate this PowerPoint diagram into their scientific, business, or educational presentations and stand out from the crowd.
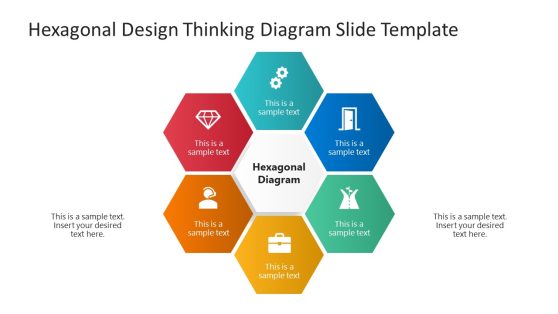
Our 100% editable diagram presentation templates and PowerPoint designs can assist you in creating an effective business presentation. The Animated Hexagonal Diagram PowerPoint Template is an animated design for professional productions. It is designed with a vibrant color scheme to ensure an impressive audience experience.
These templates are one-of-kind because they are available in various colors, styles, fonts, and font sizes. They are also compatible with Keynote, Office365, and Google Slides.
What is a PowerPoint Diagram template?
It displays numerical data using pictograms, cartograms, bar diagrams, and pie diagrams. It is the most visually appealing and appealing way of representing statistical data. Diagrams aid in visual comparison and provide a bird’s-eye view.
What are the benefits of a diagram template?
Using this template will save you the stress of designing a PowerPoint slide from scratch, which can be tiring. All you need to do is to download our pre-designed and edit it to suit your preferences.
- It gives an easy-to-understand approach to every presentation.
- It enhances information retention.
- A pictorial representation is easy to compare.
- It enhances the user’s communication with audiences.
- The audience quickly grasps the information at a glance.
- It helps in the visual representation of data.
- It makes your presentation engaging.
Why do we use diagrams?
Graphs, tables, diagrams, and charts can help your reader understand your research findings and how they compare to other data. Additionally, PowerPoint Diagrams are used to: make your boring business presentation more exciting and appealing.
- Assist the audience in comprehending your slide-through visuals.
- Display a large amount of data on a single slide with the help of a chart, images, etc.
What are the types of Diagrams?
There are numerous types of diagrams used for data presentation. The following are some examples of popular types of graphs:
- Line diagram
- Simple bar diagram
- Multiple bar diagram
- Circular or pie chart
However, there is a comparison between graphs and diagrams. A chart is a two- or three-dimensional representation of information that uses lines on two or three axes, such as x, y, and z. In contrast, a diagram is a simple pictorial representation of what something looks like or how it works.