Personalize our editable 2-Options Comparison Table PowerPoint Template to demonstrate the aspects of two considerable options. Comparisons are routine matters for professionals, marketers, and other domain experts. They help individuals identify the differences between two products of the same company, similarities between competitors, merits, and demerits of the same procedure, and much more. To serve all these purposes, we have created this 2-options comparison table PPT template for presenting comprehensive comparative analyses. The template has three different visual compositions that help users explain the content concisely. The template’s appealing layout grabs the listeners’ attention and keeps them engaged. Our template is 100% editable with all PowerPoint versions.
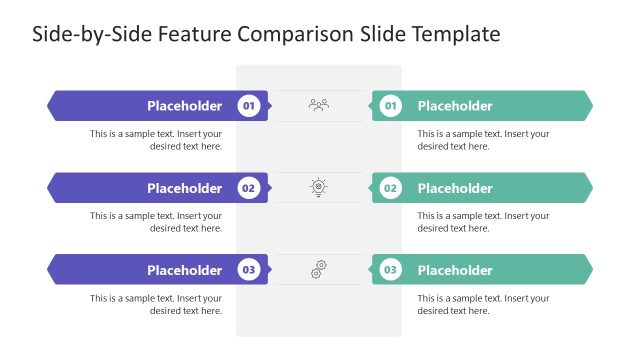
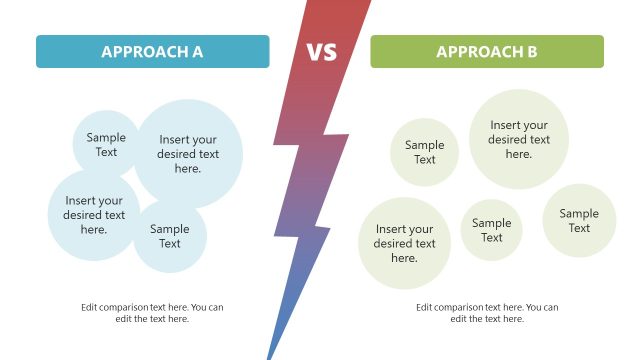
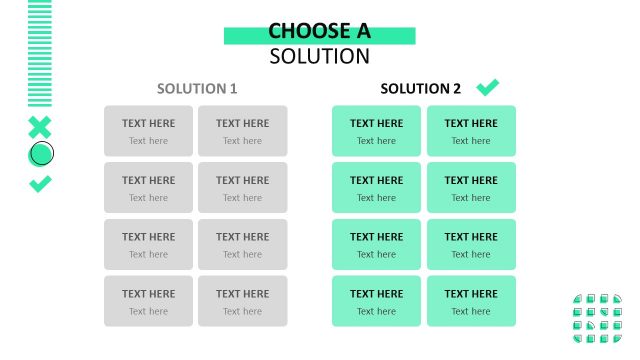
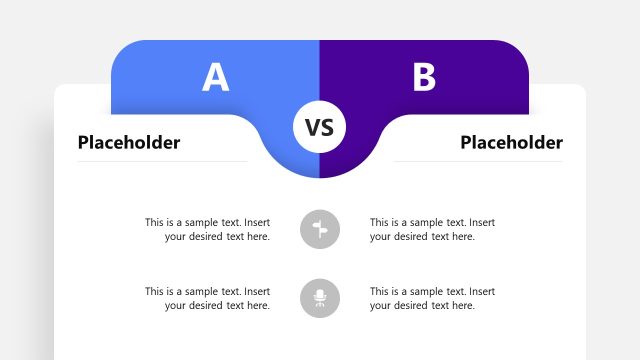
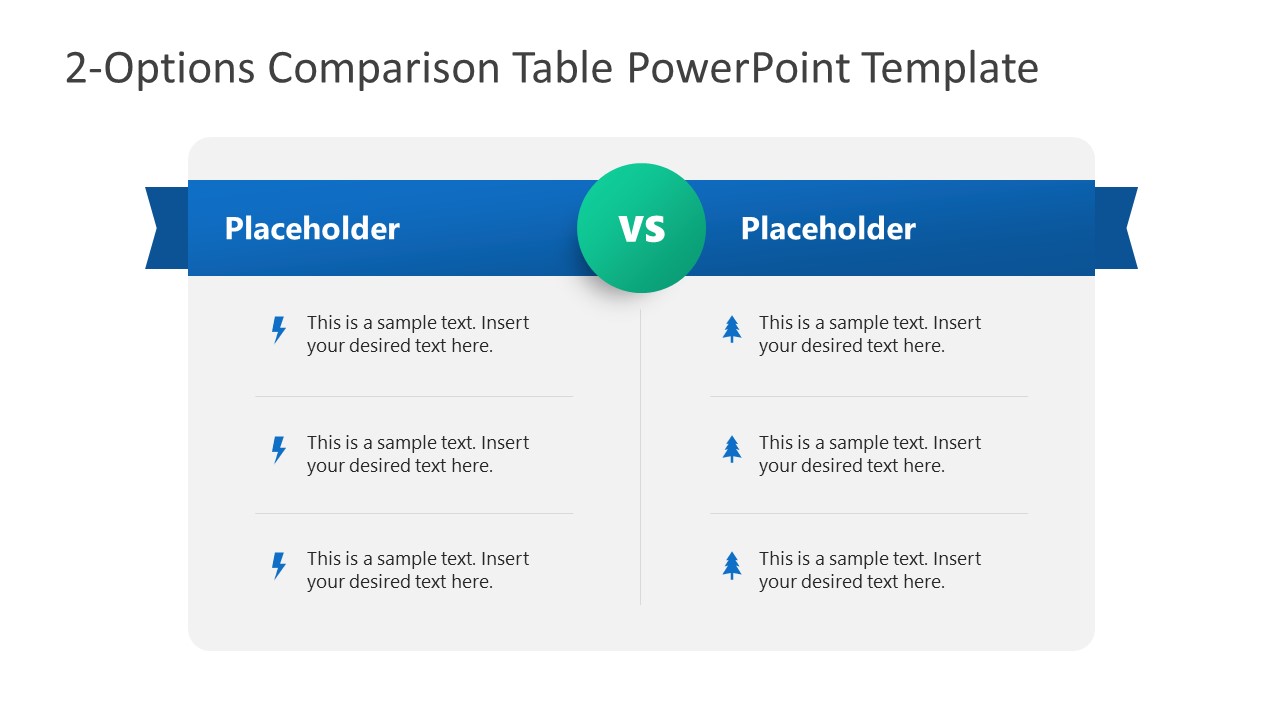
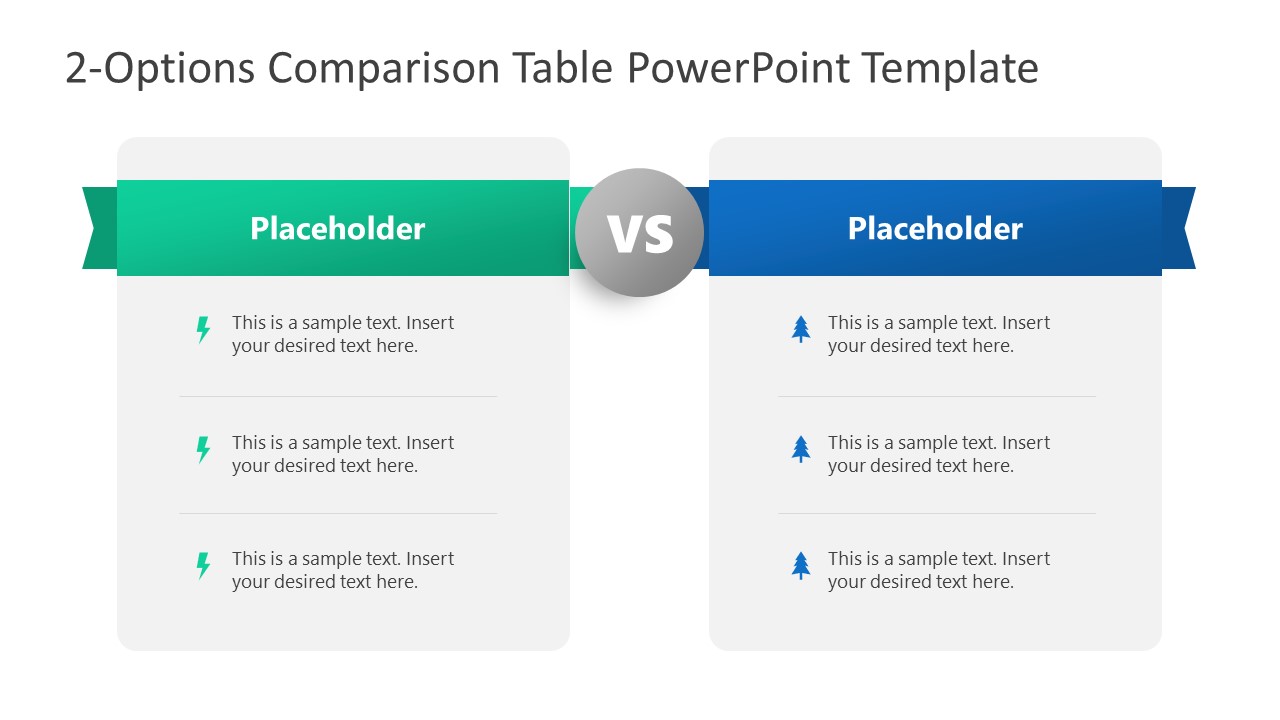
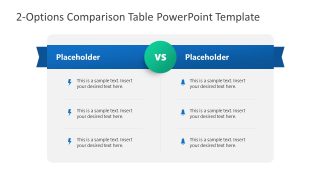
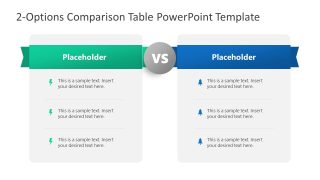
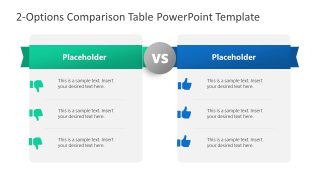
The first slide of the 2-Options Comparison Table PowerPoint Template shows a central box with two columns. The columns have three rows, each starting with a specific graphical icon relevant to the point mentioned in the row. On the top of the columns is a ribbon-shaped title bar with two text boxes and a circular shape displaying the ‘versus’ symbol. In the second slide, all the other elements are the same, while there is a gap between the two columns compared to the first slide design. The third layout has a similar arrangement of PowerPoint elements but like-buttons are used as rows icons. Also, the color of the title ribbon, circular vs shape, and the graphical icons are similar, which users can change based on their themes.
Moreover, presenters can also modify the fonts, shapes, or other features of the PPT slides. Download this unique 2-options PPT template and customize it for your business or educational presentations! Also, check our collection of comparison slides and diagram templates.
What’s inside this template
Example presentation scenarios
- A product manager can compare two feature packages for stakeholders, using the two-column table and row icons to show which criteria matter most.
- A marketing team can present a competitor comparison, using the VS badge and parallel text rows to keep both brands or offerings evaluated on equal terms.
- A consultant can guide a client through a vendor selection meeting, using the split-column layout to separate each option while keeping criteria visually aligned.
- An educator can explain the differences between two concepts or methods, using the thumbs-up and thumbs-down icon slide to make advantages and drawbacks easy to scan.
Features
- 100% editable presentation template
- Compatible with Microsoft PowerPoint
- 16:9 aspect ratio slides
- Scalable vector shapes, icons and illustrations
- AI-Ready for Microsoft Copilot and Claude
- Instant access and download
Frequently asked questions
Q: How should I present the comparison so the audience reaches a clear conclusion?
A: Start by naming the two options in the ribbon headers, then keep each row aligned to the same criterion on both sides. Use concise phrases rather than paragraphs. Reserve the icon color or thumbs-up/thumbs-down slide for the strongest difference, so the audience can separate evidence from the final recommendation.
Q: What type of presenter gets the most value from this comparison format?
A: This template works best for presenters who need to explain a binary choice, such as product teams comparing two packages, marketers reviewing competitors, consultants evaluating vendors, or teachers contrasting two concepts. It is strongest when the message depends on parallel criteria rather than a long narrative or multi-option ranking.
Q: Why use ribbon headers, a VS badge, and icons instead of a plain table?
A: The VS badge creates a direct comparison metaphor and tells the audience the slide is about contrast, not a general list. Ribbon headers anchor the two options, while repeated row icons create scanning rhythm. The thumbs-up and thumbs-down variation adds an instant visual signal for advantages and drawbacks.

2-Options Comparison Table PowerPoint Template
3-slide PowerPoint comparison table presentation template for product options, competitors, and side-by-side criteria
This 3-slide PowerPoint template presents side-by-side evaluation of two options with editable two-column comparison tables, ribbon title bars, central VS badges, row icons, and thumbs-up/thumbs-down indicators. It is designed for product teams, marketers, consultants, and educators who need to compare competitors, features, benefits, or trade-offs in Microsoft PowerPoint.
- Category
- Diagrams
- Rating

 Loading...
- Aspect ratio
- 16:9
- Item ID
- 22420-01
- Colors
 Microsoft PowerPoint
 Microsoft Copilot
 Claude for PowerPoint
Other formats supported
Subscribe today and get immediate
access to download our PowerPoint templates.