Slide 13 of 15 from Survey Presentation Template
Editable Line Chart Slide – Survey PPT Template
Survey Results Line Chart Slide
- Chart
- Line Chart
- Data Analysis Slide
- 16:9
- 100% Editable
The Survey Results Line Chart slide from the Survey Presentation Template offers a clear visualization of trends using editable slides with a line chart to display survey data effectively. This layout supports business presentation needs by combining vector icons and labeled data points for precise analysis, making it suitable for financial performance tracking and comprehensive trend analysis within a corporate presentation or pitch deck template.
What’s on This Slide
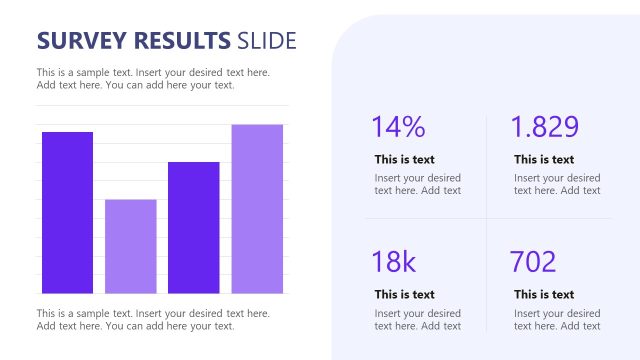
The slide features a line chart positioned centrally, displaying survey results across ten data points. Each data point is marked with a circular label showing values, with a red line connecting them to illustrate trends. Below the chart, two large text placeholders are aligned left and right, one with negative financial figures and the other labeled for additional text. The background is light, with a subtle gradient, and the title 'SURVEY RESULTS SLIDE' is prominently displayed at the top in bold, dark text. The overall layout emphasizes the chart while providing space for supplementary information.
How to Use It
This layout serves as a line chart to present survey results over time, making it suitable for showing trends in data. It fits well in a presentation sequence following data collection or analysis slides. This structure is useful for researchers and analysts to illustrate findings from surveys, allowing for clear visual communication of changes in responses. It can also be adapted for financial reports or performance tracking, where trends are critical for understanding outcomes.
Text Placeholders & Capacity
Keep your copy within these limits so it fits without resizing. Body slots can hold approximately 20-30 words each.
| Placeholder | Count | Max characters (approx.) |
|---|---|---|
| Slide title | 1 | 25 |
| Item body | 10 | 3 |
| Body paragraph | 2 | 150 |
Slide Keywords
Download unlimited PowerPoint templates, charts and graphics for your presentations with our annual plan.
DOWNLOADReturn to Survey Presentation Template.