Slide 3 of 5 from Supply & Demand Equilibrium for PowerPoint
6072-09-concept-curves-supply-demand-3
Supply and Demand Curve for PowerPoint
- Diagram
- Other
- Concept Explanation Slide
- 16:9
- 100% Editable
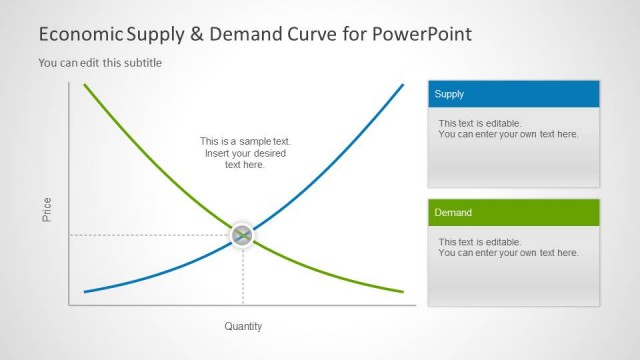
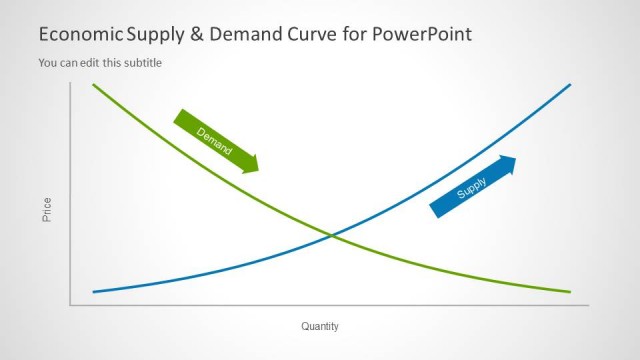
The Supply and Demand Curve Diagram slide from the Supply & Demand Equilibrium for PowerPoint template provides a clear visual tool for explaining economic principles. This slide layout uses editable shapes and vector icons to highlight market equilibrium and shifts in supply and demand, making it ideal for business presentations and case study analyses. Its design supports detailed explanations within a professional slide deck or pitch deck template.
What’s on This Slide
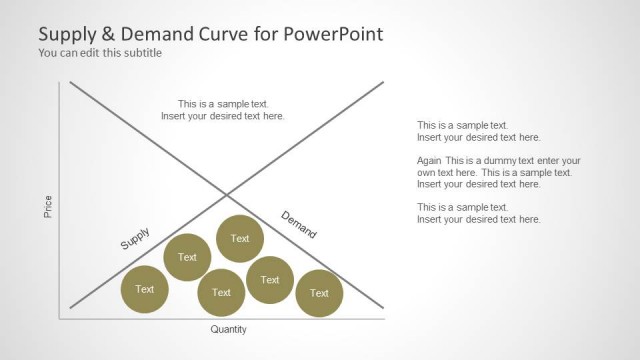
The layout features a diagonal supply and demand curve intersecting at the center. Circular nodes are positioned above the curve, each containing text placeholders, with five nodes in total. The nodes are evenly spaced and of equal size. Below the curve, there are text placeholders aligned left and right, with one central placeholder for additional information. The background is light, with a subtle gradient. The visual hierarchy emphasizes the curve and nodes, while the text placeholders provide space for detailed explanations.
How to Use It
This diagram serves to illustrate the relationship between supply and demand in economics. It fits well in a presentation sequence that discusses market dynamics, following introductory concepts. This layout is suitable for scenarios such as teaching economic principles, analyzing market trends, or presenting case studies on supply and demand. It can be used to visually represent equilibrium points, shifts in curves, or market analysis.
Text Placeholders & Capacity
Keep your copy within these limits so it fits without resizing. Body slots can hold roughly 10-15 words each.
| Placeholder | Count | Max characters (approx.) |
|---|---|---|
| Slide title | 1 | 40 |
| Subtitle | 1 | 50 |
| Item body | 5 | 30 |
| Body paragraph | 4 | 80 |
Slide Keywords
Download unlimited PowerPoint templates, charts and graphics for your presentations with our annual plan.
DOWNLOADReturn to Supply & Demand Equilibrium for PowerPoint.