Slide 1 of 5 from Supply & Demand Equilibrium for PowerPoint
6072-09-concept-curves-supply-demand-1
Supply and Demand Curve for PowerPoint
- Diagram
- Matrix Quadrant
- Concept Explanation Slide
- 16:9
- 100% Editable
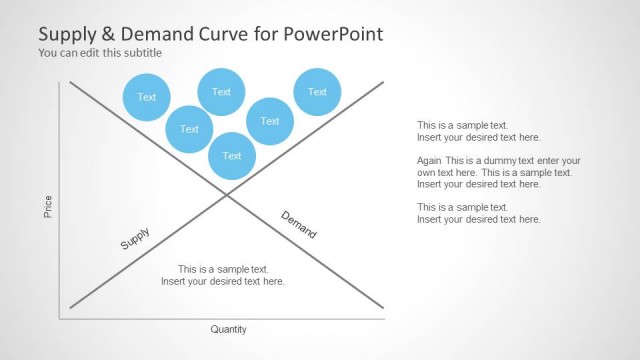
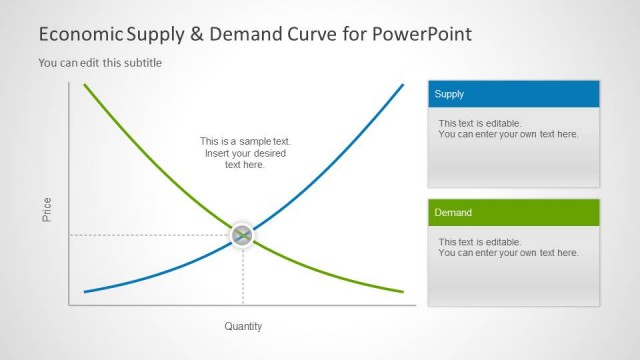
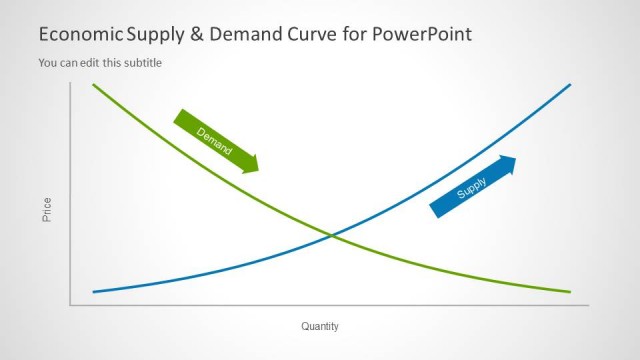
The Supply and Demand Curve slide from the Supply & Demand Equilibrium for PowerPoint template offers a clear quadrant diagram ideal for economic presentations and market analysis. This slide layout uses editable shapes and vector icons to visually explain key concepts such as surplus, shortages, and market equilibrium, making it suitable for business presentations and educational lectures focused on supply and demand dynamics.
What’s on This Slide
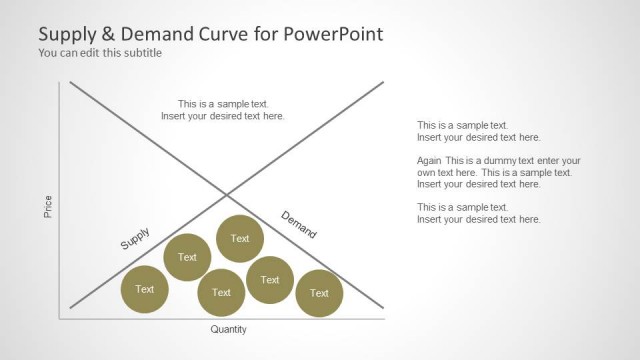
The layout features a quadrant diagram with two intersecting lines representing supply and demand. The top left quadrant contains a blue circle labeled 'Surplus' with a percentage placeholder inside. The bottom right quadrant has a green circle labeled 'Demand' with a similar percentage placeholder. Text placeholders are positioned on the right side, one for 'Surplus' and another for 'Shortages,' each with a corresponding label and sample text. The axes are labeled 'Price' and 'Quantity,' creating a clear visual hierarchy. The background is light with subtle gradients.
How to Use It
This layout serves as a foundational diagram for illustrating economic concepts like market equilibrium, surplus, and shortages. It fits early in a presentation sequence to establish key definitions and concepts. This structure is useful in educational settings, economic analysis, and business presentations where understanding supply and demand dynamics is crucial. It allows for clear visual representation and discussion of shifts in market conditions.
Text Placeholders & Capacity
Keep your copy within these limits so it fits without resizing. Node labels can hold about 10 characters each.
| Placeholder | Count | Max characters (approx.) |
|---|---|---|
| Slide title | 1 | 30 |
| Subtitle | 1 | 50 |
| Item heading | 2 | 10 |
| Item body | 2 | 40 |
Slide Keywords
Download unlimited PowerPoint templates, charts and graphics for your presentations with our annual plan.
DOWNLOADReturn to Supply & Demand Equilibrium for PowerPoint.