Gantt Chart Template for PowerPoint
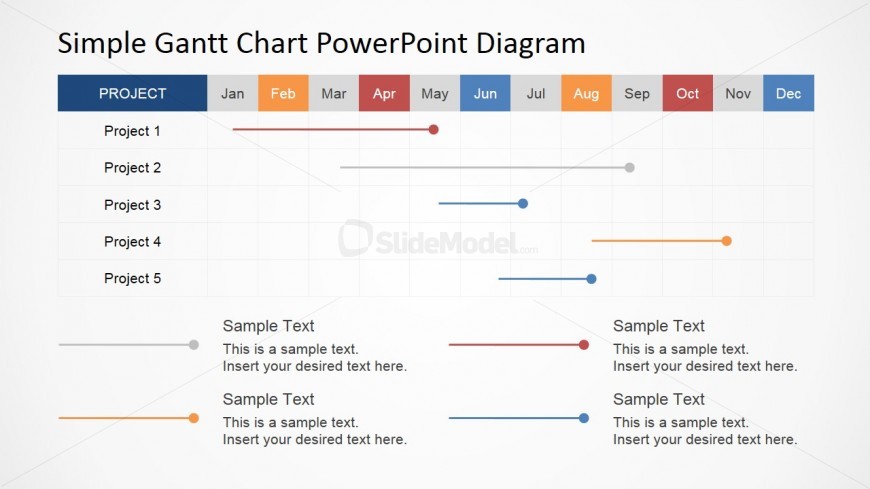
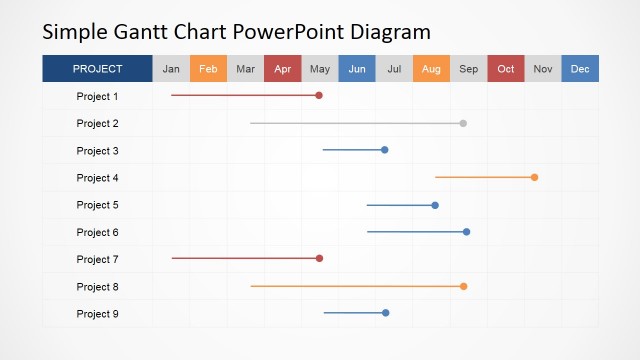
This design is a project planning and reporting tool that is intended to drive efficient results. This slide shows a grid for five projects and a monthly timeframe. This example also indicates that the time spent for Project 1 is approximately 4 and half months which range from January to middle of May. You will also notice that there is a time overlap which is from mid March up to mid September for Project 2. This may indicate time management issues if there’s just one person or team responsible for this activity. On the other hand it may also indicate related or interactive activities between Project 1 and Project 2.
Return to Simple Gantt Chart PowerPoint Diagram.