Annual Business Development Strategy
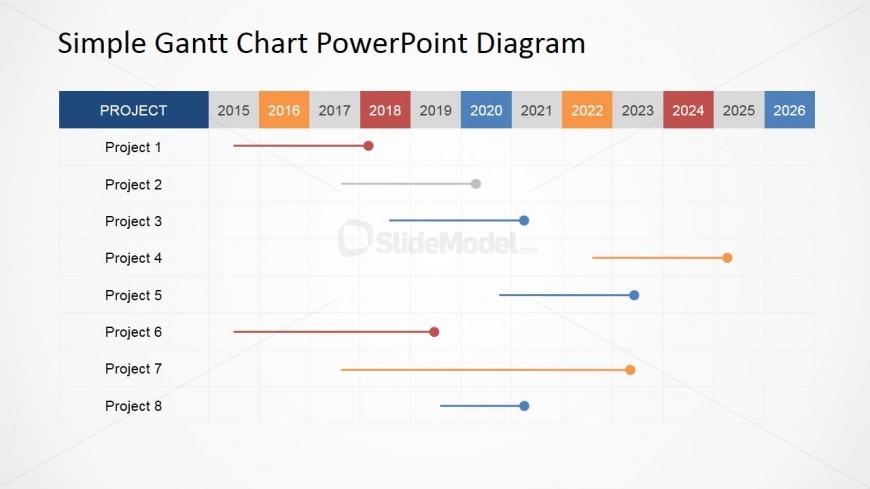
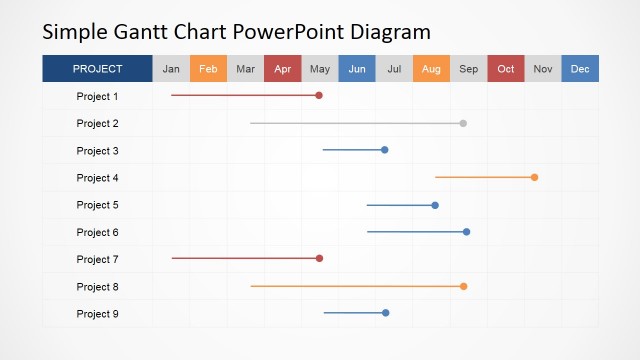
This slide is perfect as a Business development presentation tool. It’s slightly the same as slide 2. The difference is that this one has a timeframe plotted annually. In this case you can make a quick analysis on the project’s development in a long-term basis. It’s great for marking milestones for a project where the significant development happens in a long-standing manner – in this case its yearly. It is also perfect for setting yearly goals for the projects such as sales increase, product re-launch, company growth and other similar goals.
Return to Simple Gantt Chart PowerPoint Diagram.