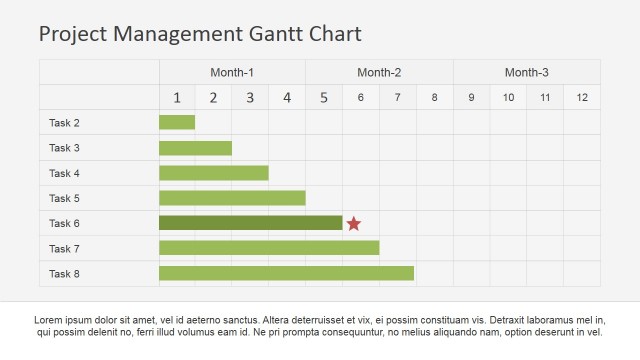
Gantt Chart Project Roadmap
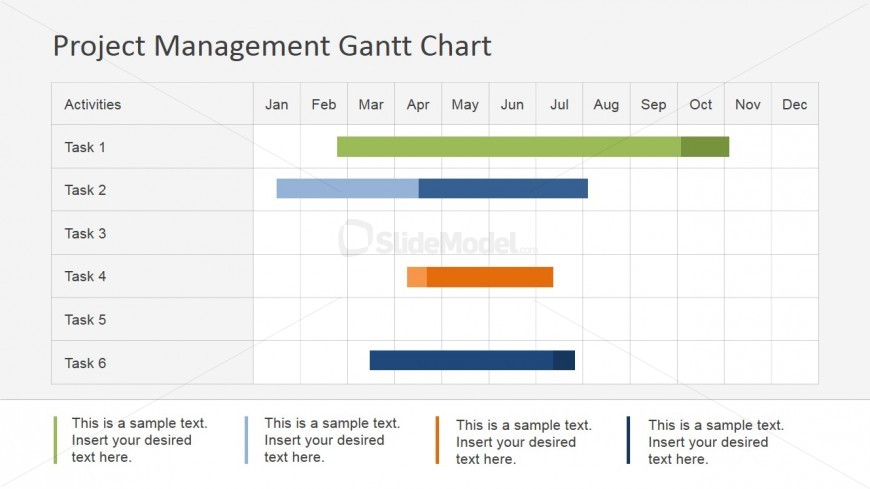
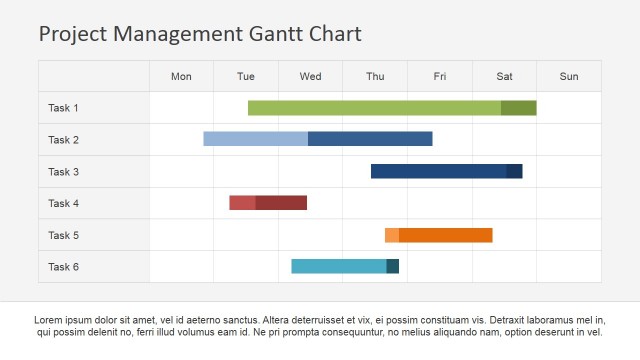
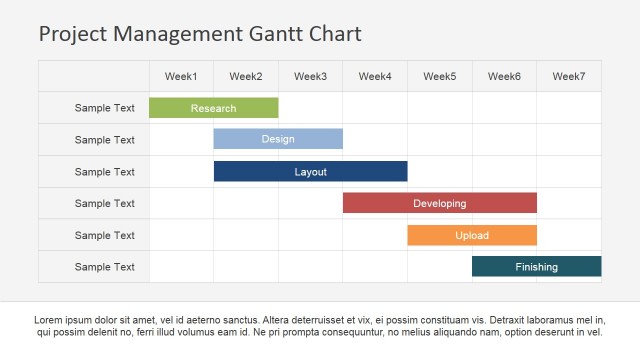
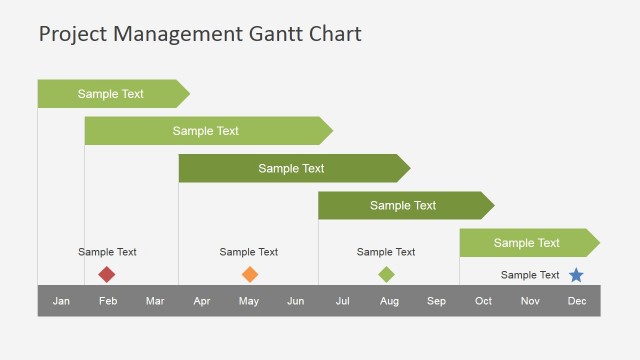
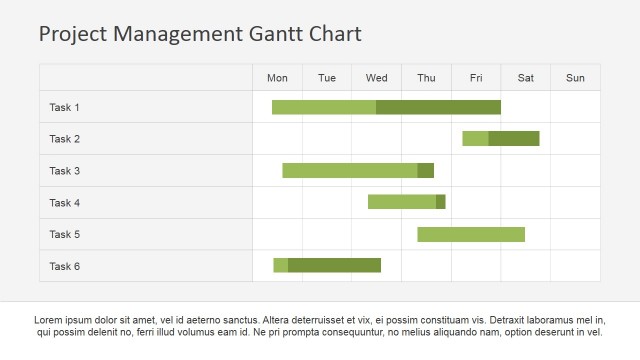
This Slide design shows how a Gantt Chart can be used to give information about various tasks which contribute to the completion of the entire project. It is a user friendly approach which uses a flat bar graphs to indicate the time duration of every individual task. Different color combinations can be used to indicate different activities groups or deliverables. The activities are plotted against time which covers an entire year starting from January and ending in December. Four separate text spaces are provided at the end of the slide to enter text. This space can be used to enter vital information related to the project. This model can be used for project planning and project roadmap review meetings.
Return to Project Management Gantt Chart PowerPoint Template.