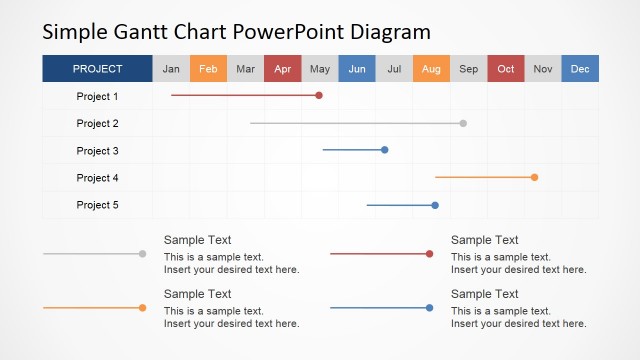
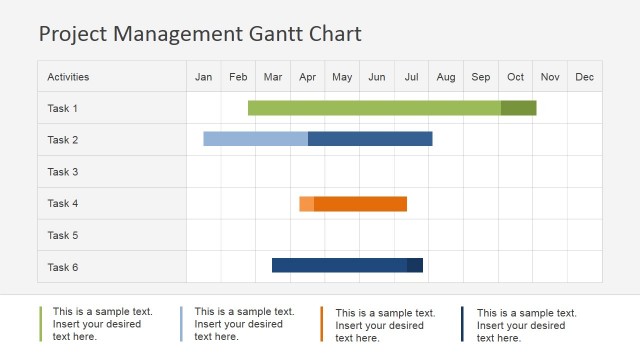
Monthly Reporting Using Gantt Chart
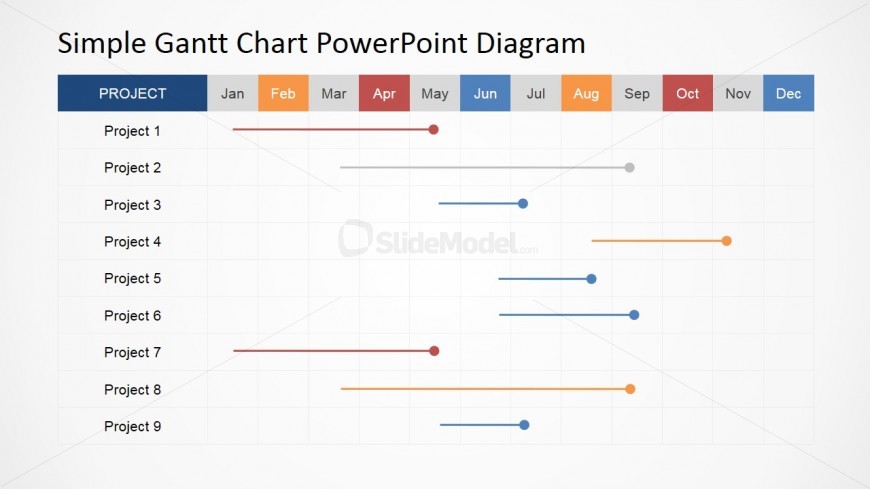
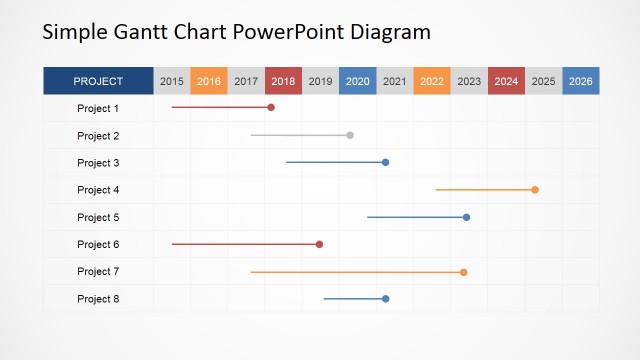
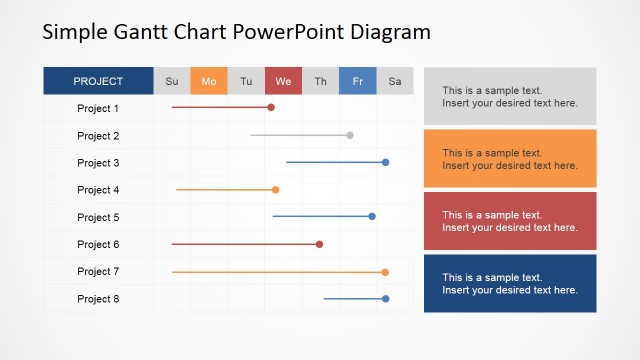
This Gantt chart design for PowerPoint allows flexibility in utilising available space by customization according to your needs. This slide shows an example containing more than 5 projects. The example shows that you will be able to monitor 9 projects at a time; being able to see the time it needed to be completed as well as its starting and ending point – all these details for 9 projects in one glance. It demonstrates how its design qualities can list numerous projects in one page which makes it easier to make comparisons. Instead of having a spare space underneath the chart for additional information, you can fill the whole slide with the chart housing more activities.
Return to Simple Gantt Chart PowerPoint Diagram.