Semi-Circular Gauge Slide PowerPoint Template
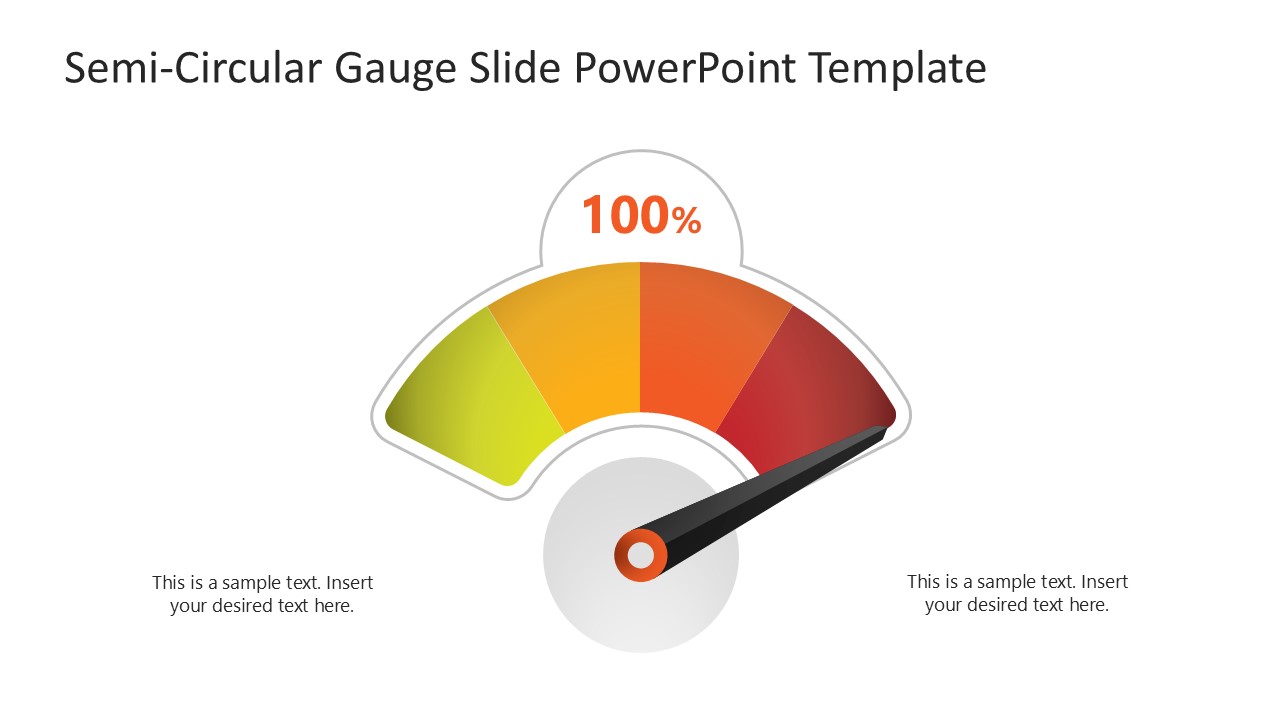
Present your employees’ performance in the annual reports with our Semi-Circular Gauge Slide PowerPoint Template. The gauge diagram helps show the performance of a person, system, or business implementation. The gauge shows whether the system is functioning fully or needs adjustment. Project managers can showcase various key performance indicators KPIs against specific targets. They quickly enable professionals to visualize if the metric is in “good,” “average,” or “bad ” range. Team leads can use this diagram in their team meetings to present how close the team is to achieving the goals. The semicircular gauge diagram template is designed for project managers, business analysts, strategy makers, and other professionals. Also, they can use it with Google Slides.
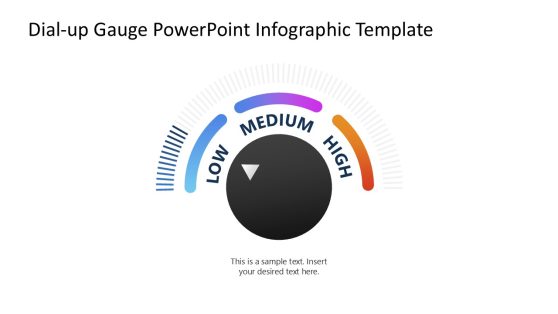
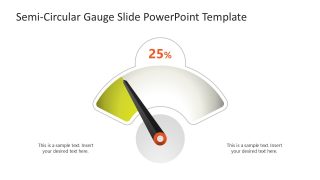
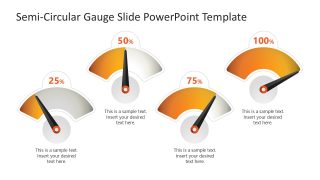
The Semi-Circular Gauge Slide PowerPoint Template features a semicircular speedometer with unique color grading. There is a needle at the center that helps mark the performance value. The color grading is specific to the presentation topic. There is a bubble shape over the gauge, which shows the value with a % sign. On both sides, two placeholder text lines can be used to display the information with clarity. The first slide shows the 100% value, the second shows 75%, the third shows 50%, and the fourth shows 25%. Moreover, the last slide contains all these diagrams on one page with gradient color bars and a text section below them.
Furthermore, users can add animations to the template to attract the audieve attention and communicate their points effectively. Project managers and analysts can adjust the sizes of the diagram, shapes, and text fonts to support thematic adjustments. Download the semi-circular gauge slide PPT template and personalize it to showcase data analysis outcomes in a visually appealing format! Alternatively, you can download other gauge infographic slides for your presentations in Google Slides, Microsoft PowerPoint and Canva.


You must be logged in to download this file.
DOWNLOAD- Category
- Diagrams
- Rating

 Loading...
- Size
- 16x9
- Item ID
- 23469-01
- Colors
Subscribe today and get immediate
access to download our PowerPoint templates.