Transformed Non Linear Data
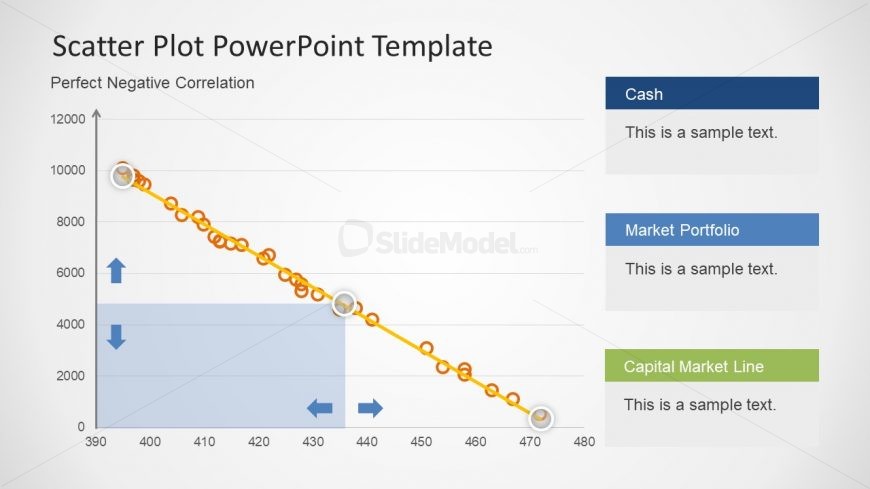
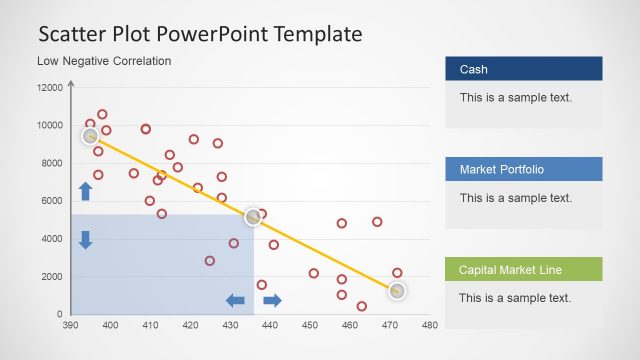
The data driven slide of Scatter Plot Diagram PowerPoint template shows perfect negative correlation. The scatter plot diagrams are used to show the linear or nonlinear relation between two entities. The data feature enables users to drive data values from existing excel sheet or make use of one available in PowerPoint. The spreadsheet table of PowerPoint can be obtained by simply clicking on the graph. On the right side, click funnel shape button to enter number and apply formulas. This is a useful template slide for research scholars or managers who work with performance reports.