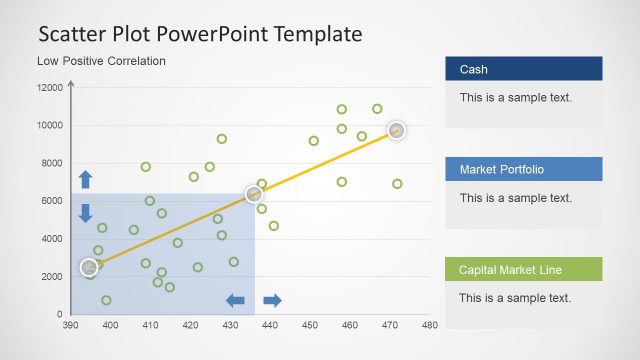
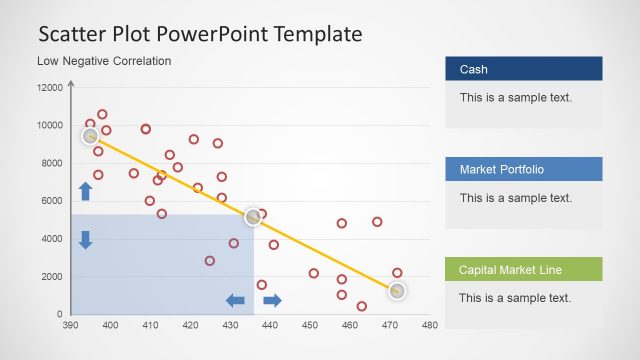
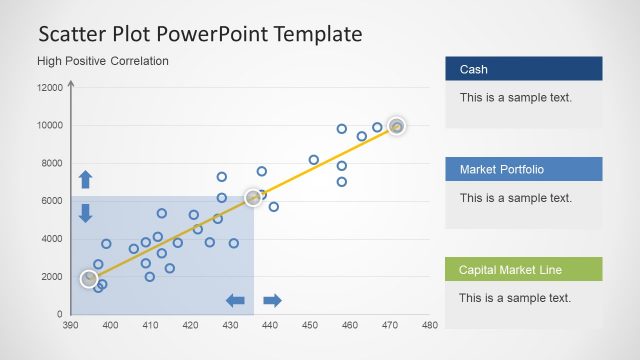
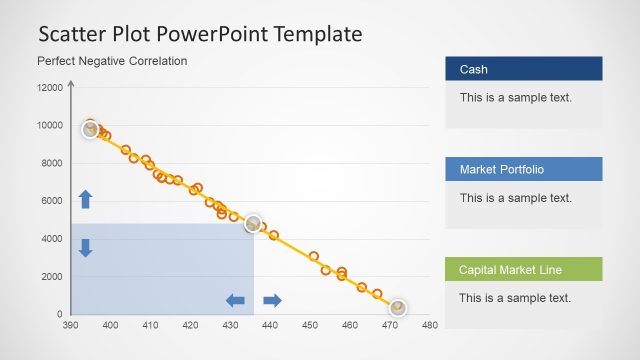
Scatter Plot Showing No Relationship
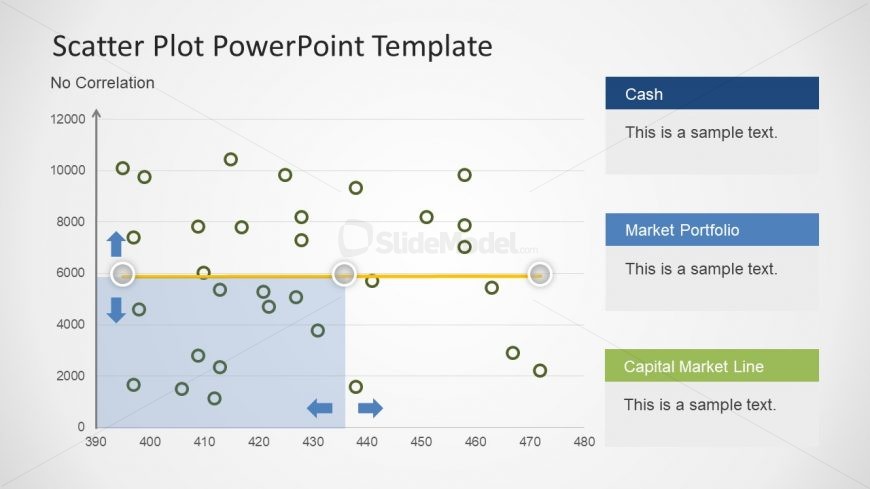
The no Correlation diagram is a Scatter Plot PowerPoint Template slide. It is a statistical data presentation slide for professionals and student. The experts and researched can take a maximum advantage from this data driven PowerPoint presentation. The correlation diagrams are important in data analysis and statistical reports occasionally. Such as, demonstrate certain relationships, ups and downs of a variable entity. With the data driven property of graph, users can add values in excel or import an excel sheet, apply formulas and represent graphically. The three placeholders on the right side of the slide are helpful in adding title and details of the report.