Cash Flow Plotting Diagram
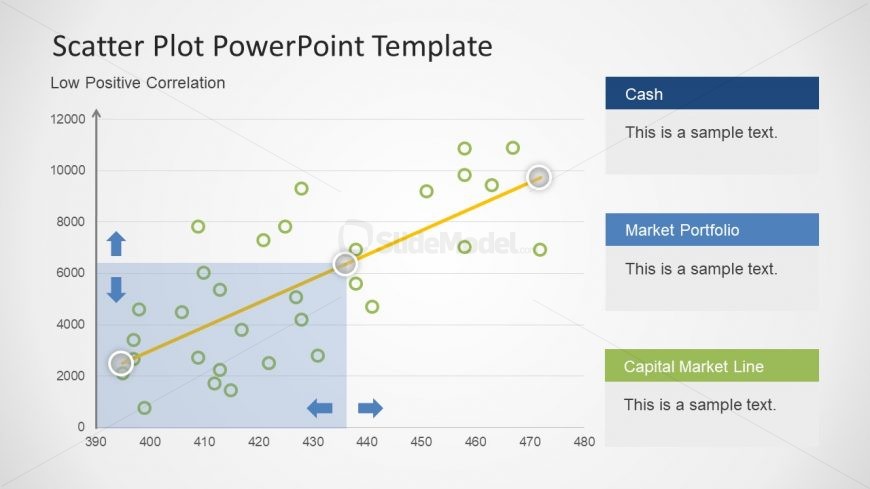
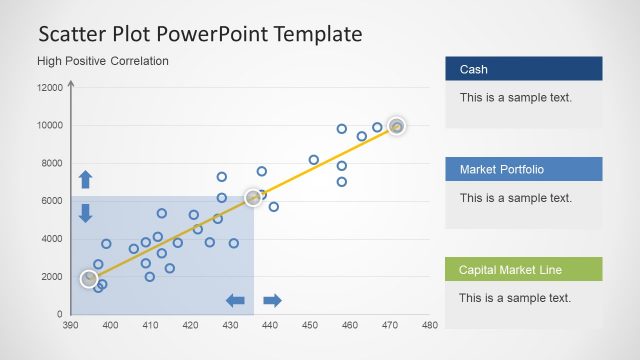
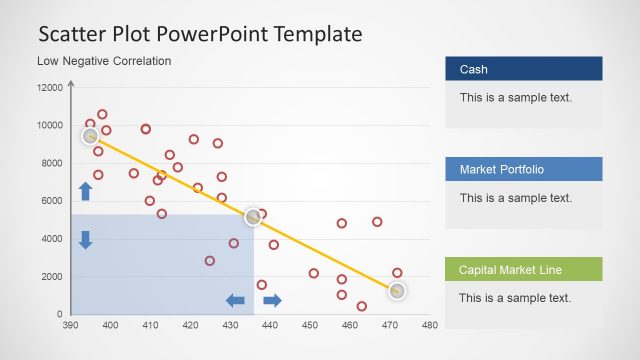
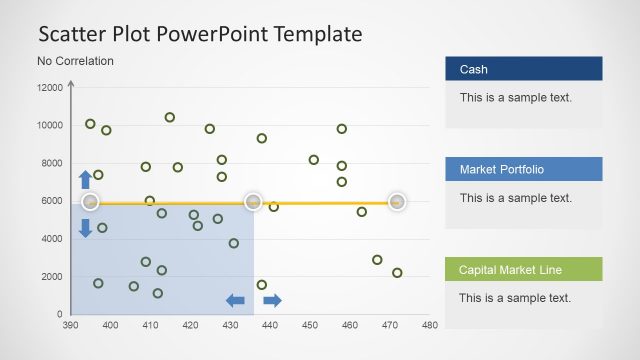
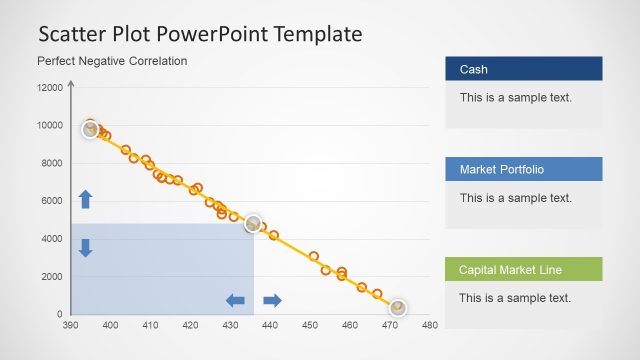
A Low Positive Correlation graph is a Scatter Plot PowerPoint Template slide. It is a useful presentation slide for professionals and students who require data analysis and statistical reports occasionally. It shows strong or weak relation of two mutually exclusive variables. The diagram in this slide is a data driven graph of PowerPoint. This helps simplify the lengthy process of editing shape manually based on user’s data values. This feature allows adding numbers in excel sheet, apply formulas. Once this is done, the graph will automatically update. Here, users can change and modify the diagram in fraction of a time.