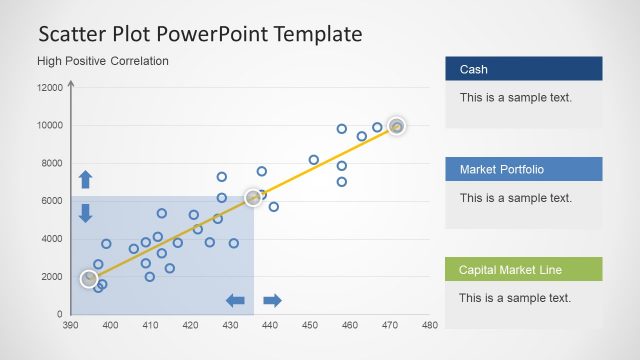
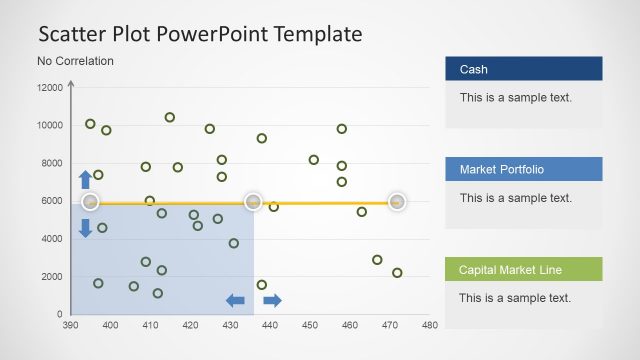
Scatter Plot Possible Results

Scatter Plot PowerPoint Template slide is an incredibly practical PowerPoint. It is helpful in analysis reports of business, research and also makes an awesome presentation for college lectures. This slide contains a perfect positive correlation diagram. It is a data driven diagram, enabling users to add and change values which reflect the graph. All of this in very few simple clicks. To add the values and variables, click on the graph and it shows three options on the right side. Click the funnel shape button to add values. These statistical graphs are used in about every part of life.