Slide 2 of 10 from Rocket Infographics PowerPoint Template
Four Phase Rocket Propulsion Diagram with Text & Percentage
Rocket Infographics PowerPoint Slide
- Diagram
- Process Flow
- Process Slide
- 16:9
- 100% Editable
The Rocket Infographics Layout from the Rocket Infographics PowerPoint Template offers a clear process flow diagram ideal for business presentations. Featuring editable shapes and vector icons, this slide template visually communicates project updates, performance metrics, and strategic planning insights within a structured slide deck. Its design supports effective data visualization in corporate presentations and pitch deck templates.
What’s on This Slide
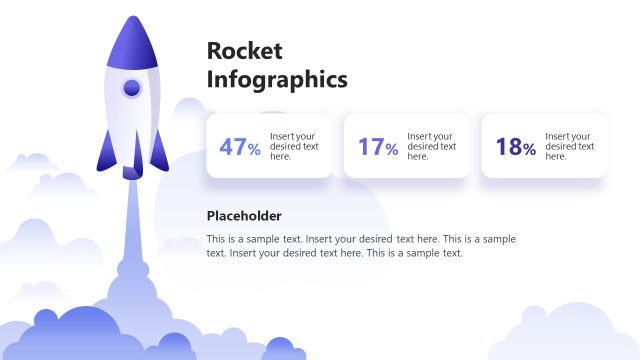
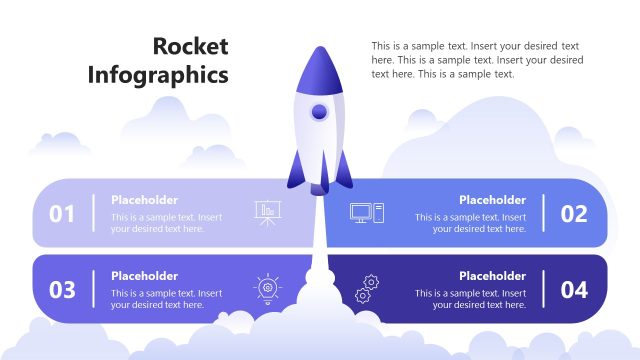
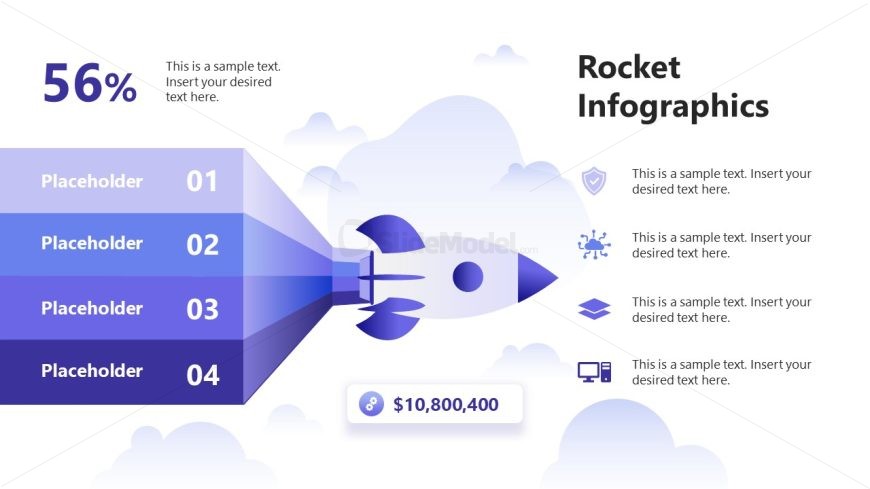
The layout features a central rocket icon launching upwards, positioned on the left side. To the right, there are four horizontal placeholders stacked vertically, each labeled with a number. The top placeholder contains a percentage figure, while the others have text placeholders aligned to the left. Below the placeholders, a financial figure is displayed in a rounded rectangle. The background includes soft cloud shapes, creating a light atmosphere. The color scheme consists of various shades of blue, enhancing visual hierarchy and clarity.
How to Use It
This layout serves as a process diagram, illustrating progress or metrics related to a project or initiative. It fits well in a presentation sequence following an introduction or problem statement, effectively summarizing key performance indicators. This structure is suitable for business contexts, such as project updates, performance reviews, or strategic planning sessions, where visual representation of data is essential for clarity and engagement.
Text Placeholders & Capacity
Keep your copy within these limits so it fits without resizing. Node body slots can accommodate roughly 10-12 words each.
| Placeholder | Count | Max characters (approx.) |
|---|---|---|
| Item heading | 4 | 20 |
| Item body | 4 | 50 |
| Kpi value | 1 | 12 |
| Body paragraph | 1 | 50 |
| Slide title | 1 | 30 |
Slide Keywords
Download unlimited PowerPoint templates, charts and graphics for your presentations with our annual plan.
DOWNLOADReturn to Rocket Infographics PowerPoint Template.