Slide 2 of 5 from Peaks and Trough Curves for PowerPoint
6072-07-concept-curves-peaks-trough-2
Concept Curves for PowerPoint - Peaks and Troughs
- Diagram
- Other
- Concept Explanation Slide
- 16:9
- 100% Editable
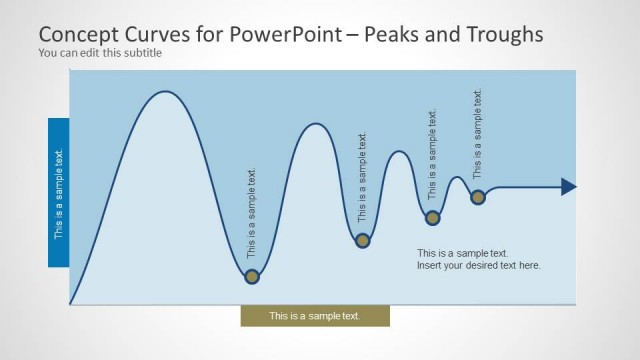
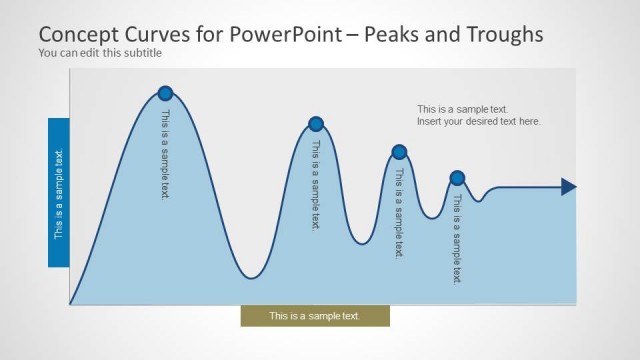
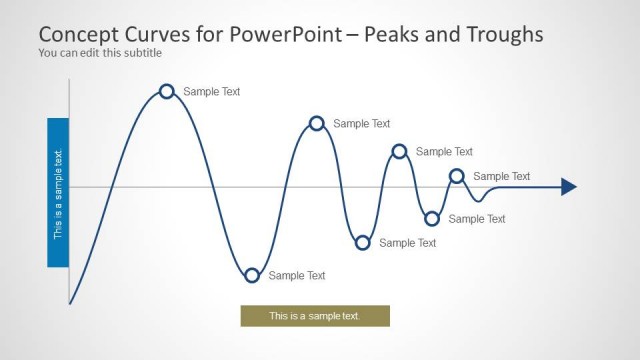
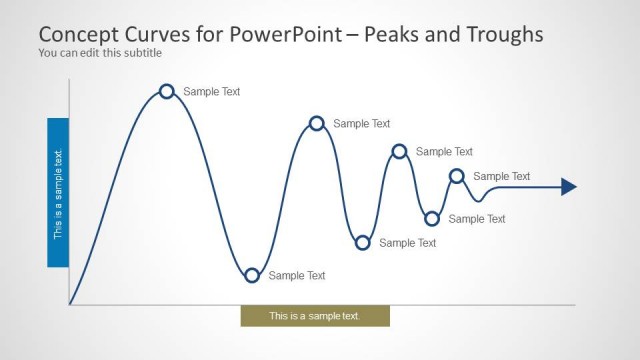
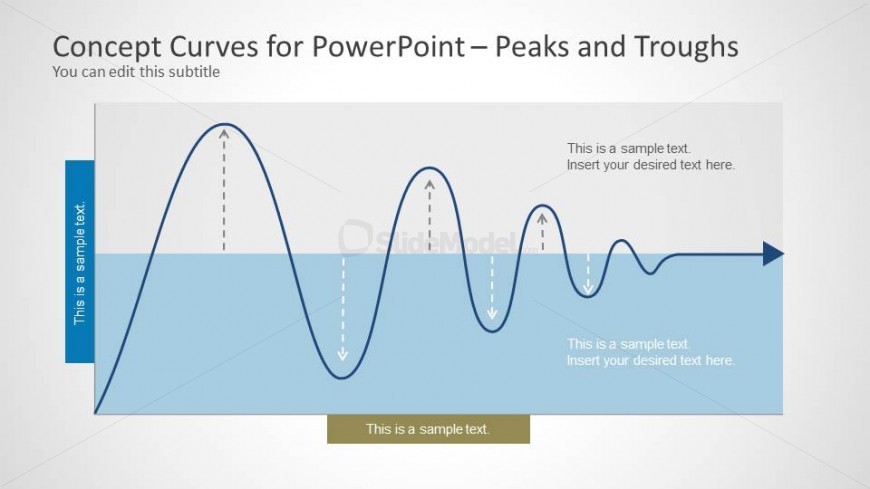
The Concept Curves with Peaks and Troughs slide from the Peaks and Trough Curves for PowerPoint template offers a clear visual tool for illustrating data trends and market fluctuations. This slide layout uses smooth wave-like curves with peaks and troughs to highlight performance metrics and project timelines, making it ideal for business presentations and analytical discussions. Its editable shapes and text placeholders support detailed explanations within a corporate presentation or pitch deck template.
What’s on This Slide
The layout features a wave-like curve spanning horizontally across the slide. The curve consists of peaks and troughs, represented by smooth lines. Text placeholders are positioned vertically on the left and horizontally at the top and bottom, with the left placeholder aligned vertically and the others aligned horizontally. The left container is colored blue, while the background is light gray. The visual hierarchy emphasizes the curve, with the text placeholders supporting the main visual. Dashed lines indicate directional flow along the curve.
How to Use It
This layout serves as a visual representation of data trends or concepts involving fluctuations. It fits well in presentations discussing performance metrics, market trends, or project timelines. The design can effectively illustrate concepts in business, finance, or digital signal processing. It is particularly useful for showcasing peaks and troughs in data, making it suitable for analytical discussions. This slide is positioned early in the sequence, setting the stage for deeper analysis or recommendations.
Text Placeholders & Capacity
Keep your copy within these limits so it fits without resizing. Body slots can hold about 5-6 words each.
| Placeholder | Count | Max characters (approx.) |
|---|---|---|
| Slide title | 1 | 40 |
| Subtitle | 1 | 50 |
| Body paragraph | 4 | 30 |