Slide 4 of 5 from Peaks and Trough Curves for PowerPoint
6072-07-concept-curves-peaks-trough-4
Concept Curves for PowerPoint - Peaks and Troughs
- Diagram
- Other
- Concept Explanation Slide
- 16:9
- 100% Editable
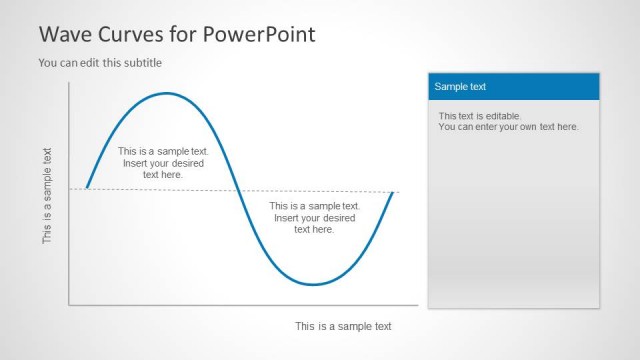
The Concept Curves for PowerPoint slide from the Peaks and Troughs Curves template offers a clear diagram layout ideal for illustrating market trends, signal processing, or performance metrics. This slide uses editable shapes and vector icons to highlight peaks and troughs along a wavy curve, making it suitable for business presentations or technical pitch decks. Its balanced design and text placeholders support effective communication of complex data within professional slide decks.
What’s on This Slide
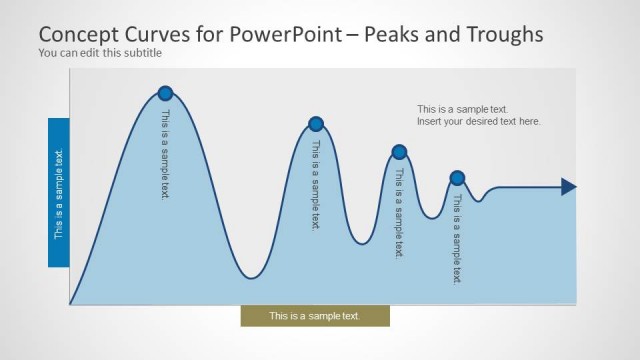
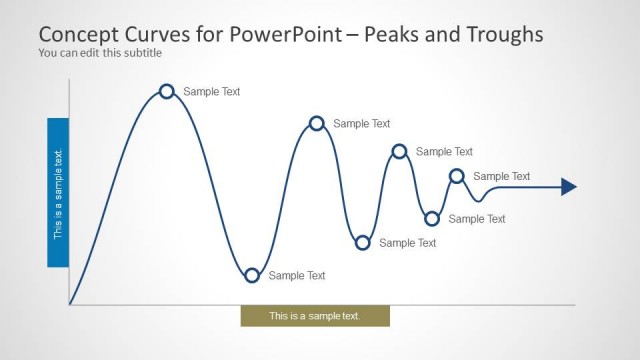
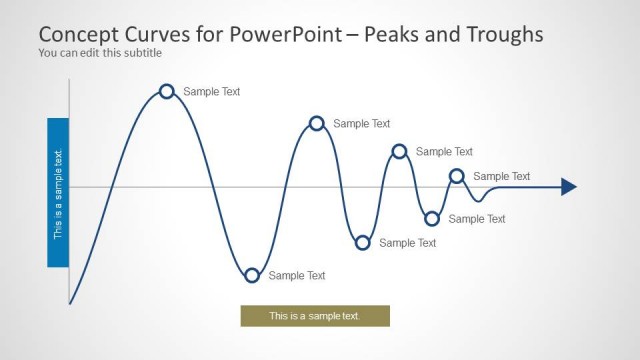
The layout features a wavy line representing peaks and troughs, spanning horizontally across the center. On the left, a vertical blue rectangle contains a text placeholder aligned vertically. The right side has a light blue rectangle with multiple text placeholders arranged vertically. Below the curve, a horizontal text placeholder is centered. The visual hierarchy emphasizes the curve, with nodes marked by circles at key points. The background is light, enhancing the visibility of the elements. The overall composition is balanced, with clear groupings of text and graphical elements.
How to Use It
This layout serves as a diagram for illustrating trends or oscillations in data, suitable for presentations in business, education, or engineering contexts. It fits well after a problem slide to visualize solutions or trends. Scenarios include analyzing market trends, discussing signal processing, or presenting performance metrics. The layout allows for clear labeling of peaks and troughs, making it effective for conveying complex information in a straightforward manner.
Text Placeholders & Capacity
Keep your copy within these limits so it fits without resizing. Text slots are moderate, with body slots holding roughly 5-7 words each.
| Placeholder | Count | Max characters (approx.) |
|---|---|---|
| Slide title | 1 | 40 |
| Subtitle | 1 | 40 |
| Item body | 5 | 30 |
| Body paragraph | 1 | 50 |