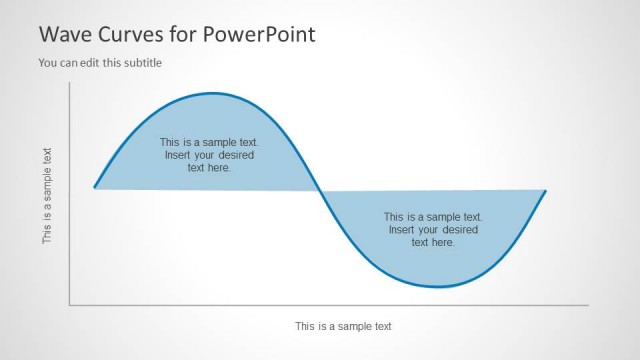
Slide 3 of 5 from Peaks and Trough Curves for PowerPoint
6072-07-concept-curves-peaks-trough-3
Concept Curves for PowerPoint - Peaks and Troughs
- Diagram
- Other
- Concept Explanation Slide
- 16:9
- 100% Editable
The Concept Curves for Peaks and Troughs slide from the Peaks and Trough Curves for PowerPoint template offers a clear visual tool to illustrate market trends and performance cycles. This slide layout uses editable shapes and vector icons to highlight oscillation concepts effectively, making it suitable for business presentations and educational slide decks that require precise depiction of data fluctuations.
What’s on This Slide
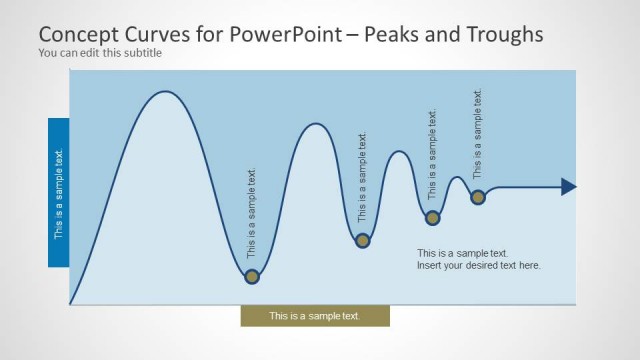
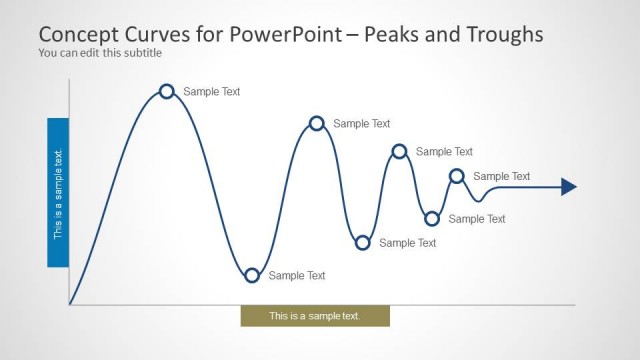
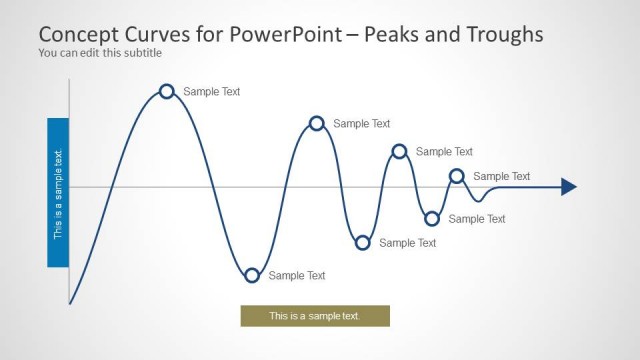
The layout features a central wave-like curve with peaks and troughs, visually representing oscillations. There are five circular markers positioned at each peak and trough along the curve. Text placeholders are aligned vertically on the left and horizontally at the bottom, with a subtitle at the top. The background is light with a gradient effect, enhancing the visual hierarchy. The curve is filled with a blue color, and the markers are outlined in blue. The overall composition is balanced, with clear groupings of text and graphical elements.
How to Use It
This layout serves to illustrate trends or cycles in data, making it suitable for presentations on performance metrics or signal processing. It fits well after problem identification slides, providing a visual representation of changes over time. This structure is useful in business contexts for discussing market trends, project timelines, or any data that exhibits peak and trough behavior. It can also be employed in educational settings to explain concepts related to oscillations or variations.
Text Placeholders & Capacity
Keep your copy within these limits so it fits without resizing. Node body slots can accommodate around 5-6 words each.
| Placeholder | Count | Max characters (approx.) |
|---|---|---|
| Slide title | 1 | 40 |
| Subtitle | 1 | 60 |
| Item body | 5 | 30 |
| Body paragraph | 1 | 50 |