Slide 6 of 17 from Operational Excellence PowerPoint Template
KPI Dashboard for Operational Performance Monitoring Design
KPI Dashboard Slide for Operational Excellence
- Chart
- Other
- Evaluation Slide
- 16:9
- 100% Editable
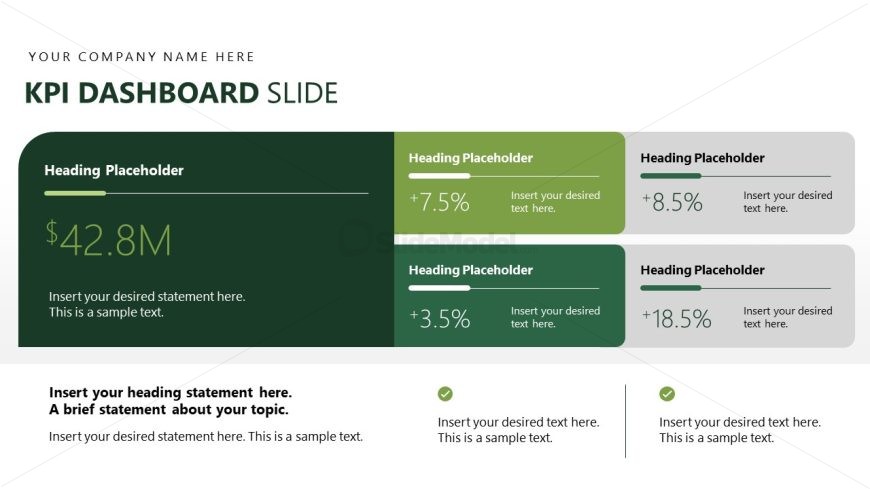
The KPI Dashboard Slide from the Operational Excellence PowerPoint Template offers a clear layout for tracking business performance and operational metrics. This slide template is designed to highlight key performance indicators with editable shapes and vector icons, making it suitable for corporate presentations and business reviews. It integrates seamlessly into slide decks focused on operational excellence, providing a structured format to present critical data and percentage changes effectively.
What’s on This Slide
The layout features a prominent title area at the top, with a large placeholder for the company name. Below, a significant KPI value of $42.8M is displayed in a bold format. To the right, there are three sections, each containing a heading placeholder and a percentage change, with two sections highlighted in green and one in gray. Each section includes a text placeholder for additional information. The overall composition is balanced, with a clear visual hierarchy emphasizing the KPI value and the percentage changes.
How to Use It
This layout serves as a KPI dashboard, presenting key performance indicators in a structured format. It fits well in a presentation sequence after discussing operational strategies or performance metrics. This slide is useful for business reviews, performance tracking, and operational excellence discussions, allowing for quick visual assessment of key metrics. It is effective for conveying progress and outcomes in a concise manner.
Text Placeholders & Capacity
Keep your copy within these limits so it fits without resizing. Node body slots can accommodate roughly 50 characters each.
| Placeholder | Count | Max characters (approx.) |
|---|---|---|
| Slide title | 1 | 30 |
| Item heading | 3 | 15 |
| Item body | 3 | 50 |
| Body paragraph | 2 | 100 |
Slide Keywords
Download unlimited PowerPoint templates, charts and graphics for your presentations with our annual plan.
DOWNLOADReturn to Operational Excellence PowerPoint Template.


